By Adrian Cheek, Senior Cybercrime Researcher
In October 2023, a coordinated ransomware attack on five southwestern Ontario hospitals forced cancer treatments to be canceled, surgeries postponed, and emergency patients diverted to other facilities. Staff reverted to pen and paper. The attack compromised 5.6 million patient visits and cost roughly $7.5 million CAD in direct recovery. Similar disruption has been observed at Humber River Hospital in Toronto, at SickKids, and at health authorities across multiple provinces. The entry point was external, reachable, and availablevisible to anyone with a browser and basic tooling through the same class of open-source reconnaissance used to produce this research.. It had been visible the entire time.
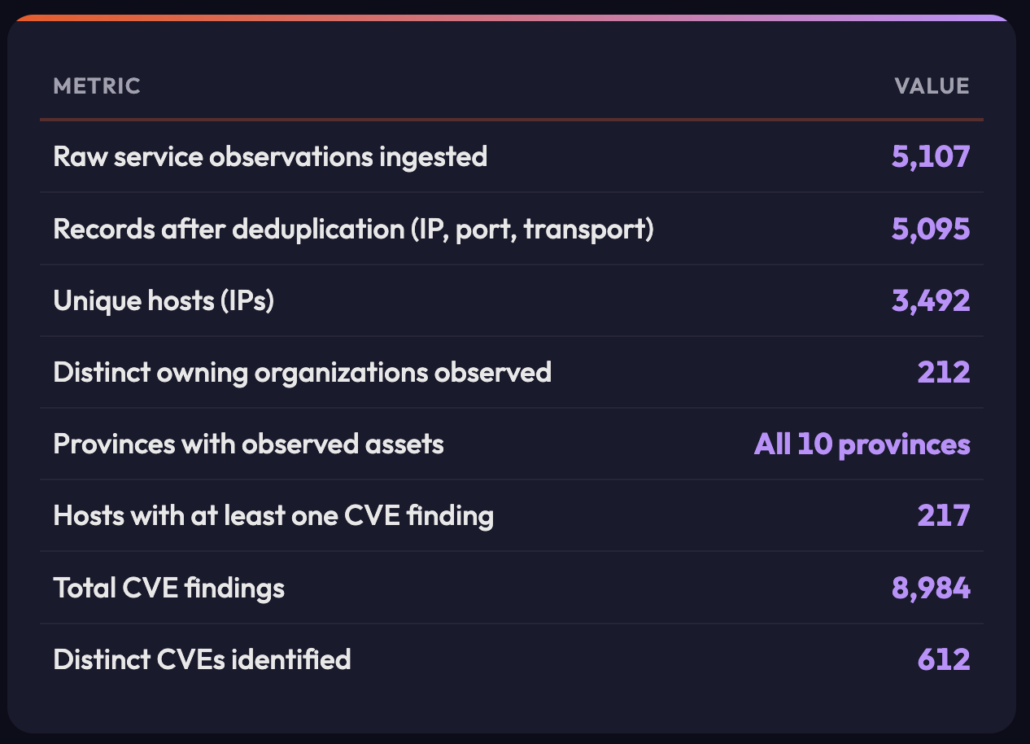
We pulled together that scan data for the Canadian healthcare sector to see what the attacker can. The result is a sector-wide picture of 3,492 unique internet-facing hosts across 212 distinct organizations spanning every province. No asset was probed, authenticated against, or exploited. Every finding in this article is reachable today by any adversary with basic tooling, and the same queries that produced it are running continuously against Canadian hospitals, clinics, and health authorities right now, by parties with far less friendly intentions.
The headline numbers are worth sitting with: 217 hosts carry at least one CVE finding. 136 of those carry a critical-rated CVE, with a CVSS (Common Vulnerability Scoring System, an open, industry-standard framework used to assess and rate the severity of software vulnerabilities) score of 9.0 or higher. 54 distinct critical vulnerabilities were identified across the sector, many of them in the same edge appliances and web stacks that have featured in published incident reports for recent attacks. And six hosts across six organizations match the exact tradecraft called out in a joint CISA, FBI, NSA, EPA, DOE, and CNMF advisory issued on April 7, 2026.
Key Findings About Canadian Healthcare Exposures
- 136 healthcare hosts have at least one critical-rated CVE (CVSS 9.0 or higher), spanning 54 distinct vulnerabilities. Many are in the same software and network equipment linked to major breaches at healthcare organizations.
- The most widespread issue involves Apache HTTP Server, a common web technology. A cluster of legacy Apache vulnerabilities each appears on 72 separate healthcare systems, making them among the most pervasive risks in the dataset, the signature of long-lived web fronts that have not been refreshed.
- Across six healthcare organizations, six systems show the exact attack patterns flagged in a recent joint advisory (FBI, NSA, CISA, and several other federal agencies), with VNC remote-access exposure is the dominant category, concentrated in London, Ontario (precisely the remote-access fingerprint the advisory warns about).
- Over 1,000 healthcare hosts run plain HTTP on the public internet. 484 expose SNMP without v3 authentication (leaking network topology and credentials). 10 hosts run cleartext FTP, five expose RDP directly, six expose SMB, and two hosts expose DICOM medical imaging protocols on routable addresses. DICOM was not designed for untrusted networks; any direct exposure carries PHI.
- Saskatchewan shows the highest critical-CVE concentration at 33.3% of observed hosts, followed by Quebec (7.5%) and British Columbia (6.1%). Ontario carries the largest raw host count (2,451) with 93 critical-CVE hosts, but a lower relative rate (3.8%), reflecting the scale of its health sector rather than elevated risk. Small provincial estates carry an outsized share of exploitable risk.
- The exposure classes identified in this research are the documented step-one entry points for every major healthcare breach in recent years.
What Would an Adversary Find if They Ran This Query Against Your Organization Tomorrow?
An organization-specific exposure review can be completed non-intrusively within days: a prioritized remediation backlog mapped to the hosts, products, and services an adversary sees today.
The Advisory That Should Have Been Read More Carefully
AA26-097A is a joint advisory issued on April 7, 2026 by CISA, the FBI, the NSA, the EPA, the DOE, and CNMF. It warns of Iranian-affiliated APT activity targeting internet-facing operational technology across North American critical infrastructure, with specific attention to Rockwell Automation and Allen-Bradley programmable logic controllers. The activity is attributed to IRGC-CEC-linked operators tracked as CyberAv3ngers, Shahid Kaveh Group, Hydro Kitten, Storm-0784, and UNC5691. Several of these groups have a documented track record of destructive operations rather than financially motivated ones. The operational goal is disruption, not extortion, and there is no ransom note to negotiate.
The advisory is written with water, energy, and manufacturing in mind, and is applicable internationally. The Canadian Centre for Cyber Security (CCCS) has consistently flagged the same exposure patterns in its National Cyber Threat Assessment 2025-2026, and healthcare is a designated Critical Infrastructure sector under Canada’s National Strategy for Critical Infrastructure. Connected medical devices, building management systems, HVAC, and clinical engineering stacks all live on the same entry surface the advisory describes.
Testing the Advisory Against Healthcare Scan Data
The fingerprint is straightforward to test. Rockwell and Allen-Bradley devices talk EtherNet/IP on port 44818 and produce distinctive product banners. VNC exposes remote access to HMI displays and engineering workstations on port 5900. Telnet carries cleartext administrative sessions. A wider set of OT protocols, including Modbus, DNP3, BACnet, Siemens S7, Niagara Fox, and IEC-104, sit on their own well-known ports.
Running those queries across the Canadian healthcare attack surface, the findings that stand out are remote-access exposures rather than industrial controllers:
- London, Ontario: A healthcare organization is exposing VNC endpoints directly on the public internet. That is the same remote-access pattern adversaries use to manipulate HMI displays and clinical engineering workstations. VNC alone does not confirm OT involvement (the protocol lives on both IT and OT assets and banner-based detection cannot always distinguish them), but reachable remote-access sessions from a healthcare owning organization deserve immediate validation against internal asset inventory.
- Toronto and Saskatoon: Telnet exposure appears on a small number of hosts. Cleartext administrative access on a routable address is the clearest candidate for immediate remediation.
- No internet-exposed Rockwell or Allen-Bradley EtherNet/IP endpoints were observed in this research.
A note on naming: The specific organizations behind these findings are not named in this article, which is a deliberate editorial choice. Identifying them by name would shorten the distance between reading this article and targeting the hosts it describes. The identities sit in the same public scan data that produced the rest of the research, meaning any adversary who wants them can have them within minutes. The defenders at those organizations deserve the time to remediate without a published article acting as a waypoint for the next attacker, and that principle applies across the following findings.
The broader table of AA26-097A-aligned indicators across the sector includes:
| City | Prov | Rockwell | VNC | Telnet | Other OT | Hosts | Orgs |
|---|---|---|---|---|---|---|---|
| London | ON | – | 2 | – | – | 2 | 2 |
| Brantford | ON | – | – | – | 1 | 1 | 1 |
| Toronto | ON | – | – | 1 | – | 1 | 1 |
| Kemptville | ON | – | – | – | 1 | 1 | 1 |
| Saskatoon | SK | – | – | 1 | – | 1 | 1 |
| Total | – | 2 | 2 | 2 | 6 | 6 |
Six hosts across six organizations show at least one AA26-097A-aligned indicator. Cell values are host counts. These are indicators, not confirmed OT exposures. Validation against internal asset inventory is required before treating any single row as a confirmed finding.
How Exposure Becomes an Incident
The indicators above are step one of a documented attack sequence. The path from a visible service to a clinical disruption has been published in detail by the Canadian Centre for Cyber Security, CISA, Mandiant, Microsoft, and the FBI, across advisories covering Rhysida, BlackCat/ALPHV, LockBit, BianLian, Daixin, Black Basta, Scattered Spider, and the Iranian-affiliated clusters named in AA26-097A. The opening moves are identical across all of them.
External reconnaissance identifies exposed edge devices, VPN gateways, web applications, or remote-access protocols, using the same open-source data this research is built on. The adversary targets a known CVE, a default or stolen credential, or a protocol misconfiguration, and gains an authenticated foothold inside the network. They move laterally, elevate privileges, disable backups and security tooling, and identify clinical and billing systems. From there the path forks into three branches:
Branch 1: Encryption and Extortion
Financially motivated operators stage data for exfiltration, encrypt, and extort. The double-extortion model is now the norm, because stolen patient data pressures the victim into paying even when backups are clean. Initial access to encryption typically runs in 24 to 72 hours. The Daixin Team attack on five southwestern Ontario hospitals in October 2023 followed exactly this pattern.
Branch 2: Exfiltration Only
No encryption, no ransom note, no obvious disruption. The data is sold on cybercrime markets, reused for medical identity fraud, or held for a later leak. Healthcare records are the most valuable category on most illicit markets precisely because they combine PII, insurance details, and clinical history in a single record, which cannot be reissued the way a credit card number can. These operations can run for weeks or months undetected.
Branch 3: Destructive Operations
AA26-097A warns about the pattern of wipers, firmware bricking, and deliberate corruption of databases and EHR backing stores. Recovery is not a matter of paying a ransom. It depends on whether the organization had offline backups that survived, and how long restoration takes with clinical operations halted. Destructive operations execute in minutes once the operator triggers them.
Patient diversion, surgery cancellations, and EHR downtime begin within the same window in all three cases.
The Exposed Entry Points
The exposure classes this research surfaces are the documented step-one entry points for every stage of that sequence. Edge devices and remote-access appliances are the most consistent initial-access vector in recent healthcare ransomware and nation-state cases.
| Product / Service | Findings | Hosts |
|---|---|---|
| F5 BIG-IP | 507 | 407 |
| Check Point (gateway and web) | 224 | 131 |
| Citrix NetScaler / ADC | 108 | 106 |
| FortiGate | 31 | 29 |
| SonicWall | 26 | 15 |
| Outlook Web App / OWA | 22 | 21 |
| Microsoft Exchange (direct) | 15 | 12 |
| Ivanti Connect Secure / Pulse | 8 | 4 |
| PPTP endpoints | 6 | 6 |
| Cisco ASA SSL VPN | 4 | 4 |
| Telnet services | 2 | 2 |
Presence on that list does not imply vulnerability. It does imply an attack surface requiring aggressive patching cadence and MFA enforcement. Every product in the top half of the list has been the subject of named vulnerabilities exploited in the wild within the last 18 months.
Protocol-Level Exposure
Exposed ports and services carry meaningful risk if reachable from the public internet. These are not CVE findings; they represent protocol-level exposure that increases attack surface regardless of patch state.
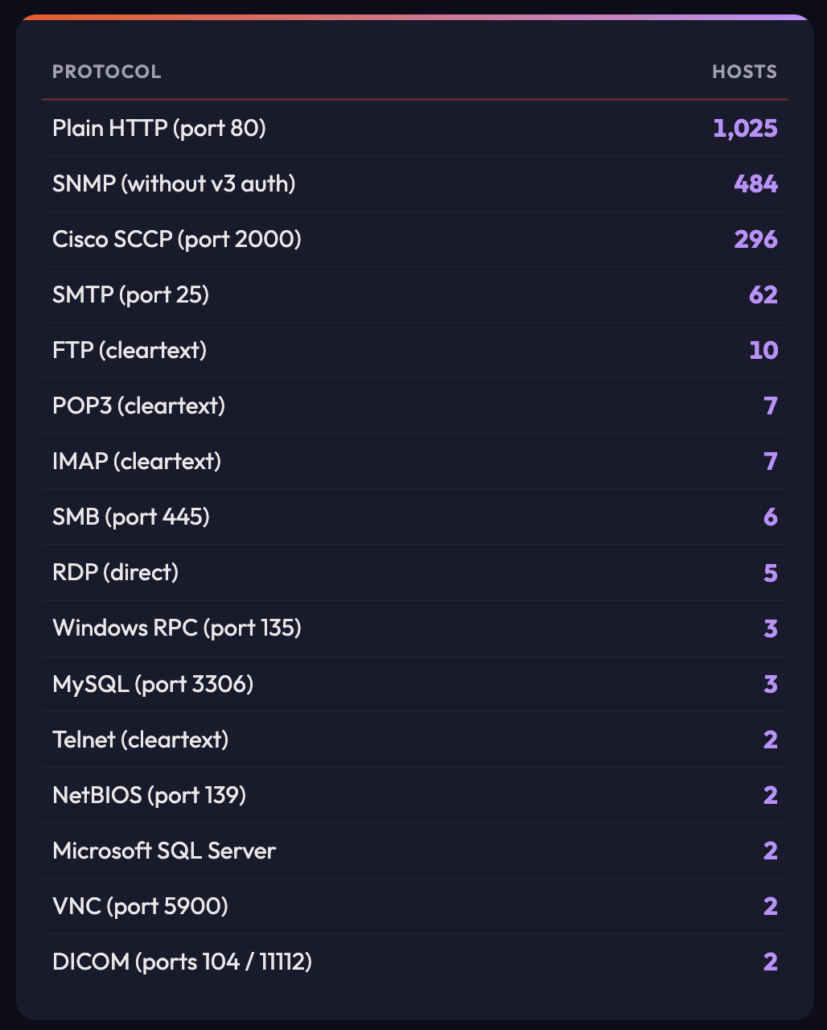
Cleartext FTP, HTTP, POP3, and IMAP exposure on public ranges allows credential interception. Windows RPC and SMB exposure on the public internet remains the class of mistake that preceded WannaCry and NotPetya. SNMP without v3 authentication can leak network topology and credentials. DICOM and HL7 were not designed for untrusted networks; any direct exposure on a public IP is a significant finding because these protocols carry protected health information (PHI).
Where the Critical Findings Cluster
Raw host counts tell you where exposure is concentrated. Critical-CVE rate tells you where the risk concentrates. The two do not always match.
Provincial Distribution
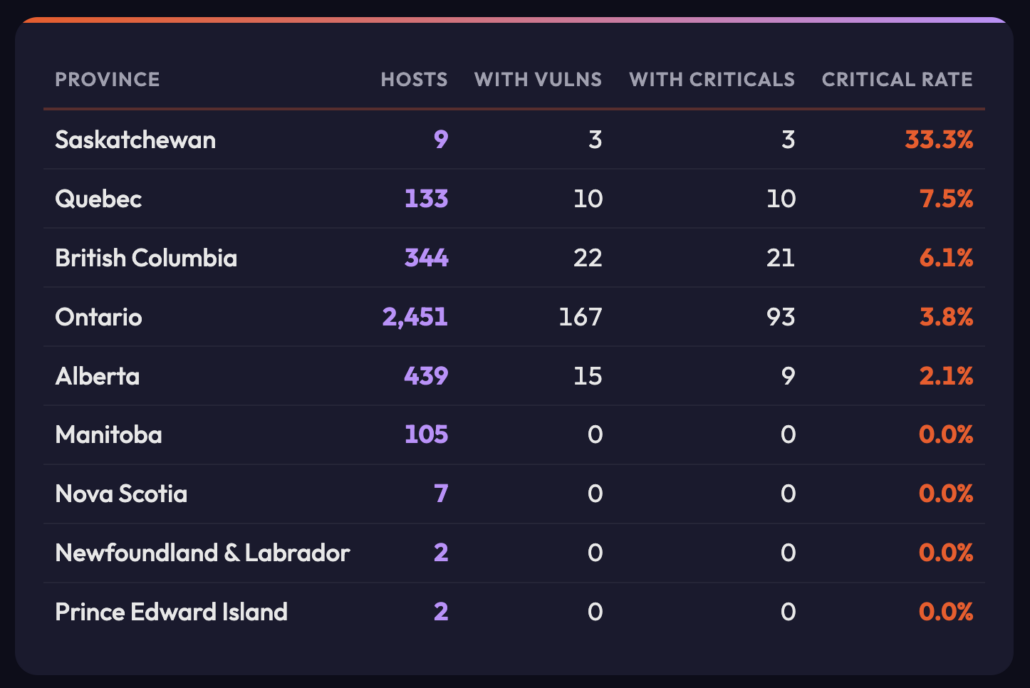
Saskatchewan stands out: a third of its small observed estate carries at least one critical-rated vulnerability, which is the signature of a small estate carrying an outsized share of exploitable risk rather than a large absolute count. Ontario carries the largest raw count of hosts and critical CVEs, reflecting the scale of its health sector rather than a higher relative risk. Manitoba, Nova Scotia, and the Atlantic provinces show smaller observed footprints that may reflect research breadth rather than an absence of exposure.
Banner-based matching can inflate counts where one vulnerable web stack is shared across many locations behind a single owning organization, so provincial totals should be read as a triage signal, not a scorecard.
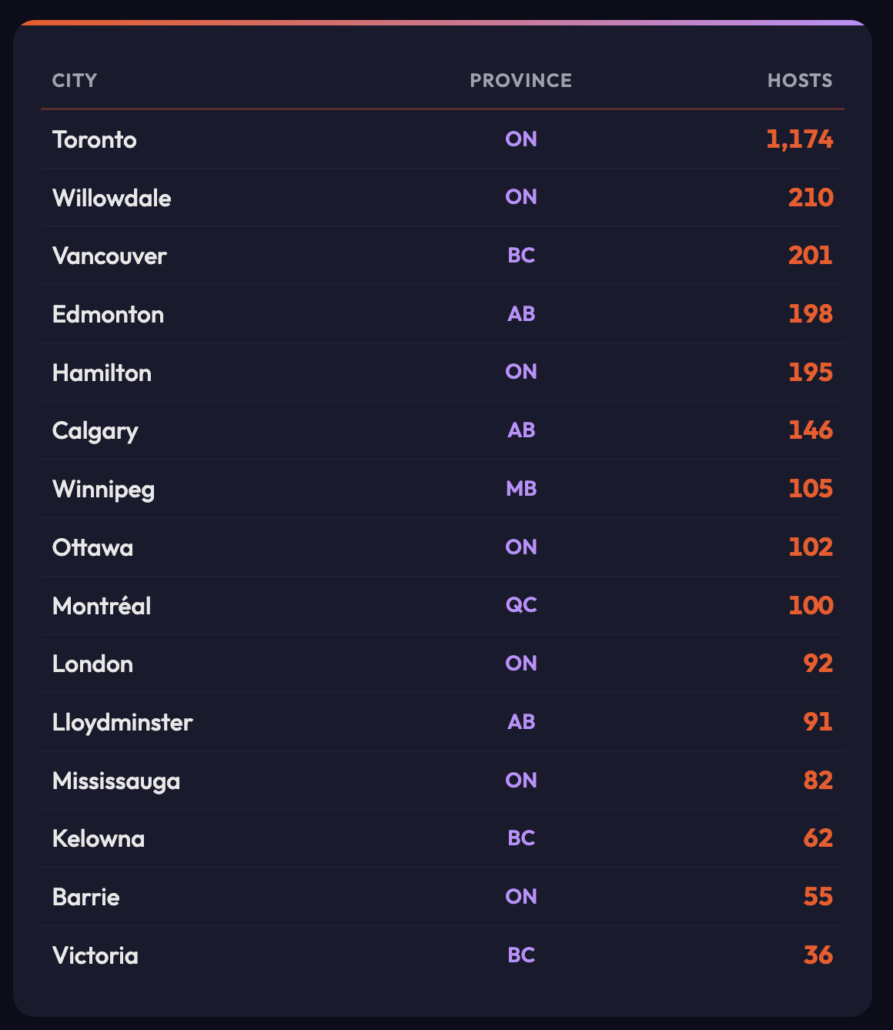
City-Level Hotspots
Cities with the highest observed host counts. Host counts can cluster heavily on a small number of owning organizations per city, so city figures should be read as where exposure is concentrated, not as a population-normalized risk score.
CVE Concentration
At the CVE level, the concentration is around Apache HTTP Server, which reflects the commonality of that stack behind healthcare web properties. A legacy Apache cluster (including CVE-2011-2688, CVE-2013-4365, and CVE-2007-4723) appears on 72 hosts each: the signature of long-lived web fronts and appliances that have not been refreshed in over a decade. More recent Apache issues including CVE-2025-58098 (Server Side Includes, 58 hosts) and CVE-2025-59775 (SSRF on Windows, 56 hosts) round out the most prevalent findings.
Among known-exploited CVEs, the Apache mod_rewrite cluster (CVE-2024-38474, 38475, 38476) appears on 32 hosts each, with public proof-of-concept code and mass-exploitation activity already reported. These are consistent with the opportunistic exploitation chains that precede lateral movement and data theft.
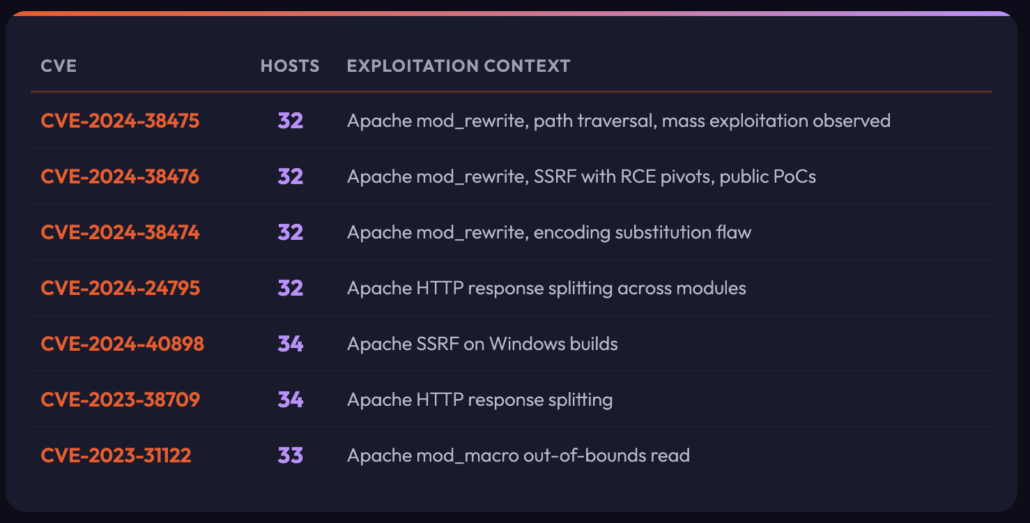
Host counts reflect the number of exposed assets where banner fingerprinting flagged the CVE
CVE Severity Distribution
CVSS severity grouping of the 612 distinct CVEs identified across the in-scope assets:
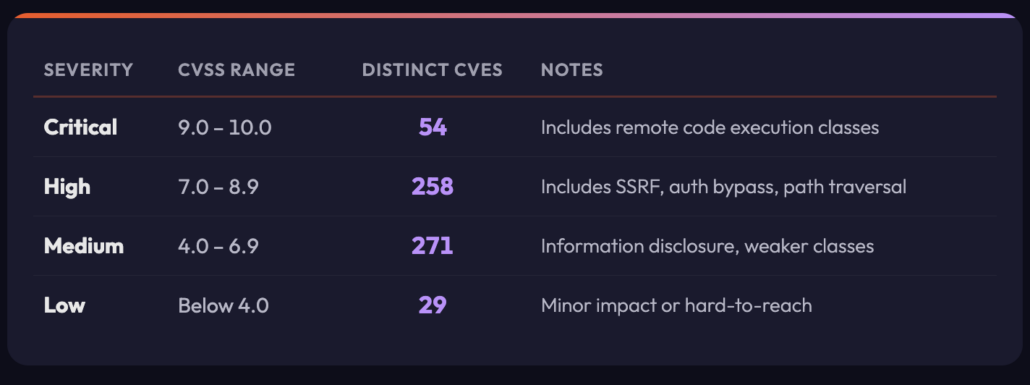
136 hosts have at least one critical-rated CVE finding. 163 hosts have at least one high-rated finding. Critical CVE findings total 1,037 across the data.
Why This Is a Patient Safety Issue, Not an IT Backlog
The exposure classes in this research are the documented initial-access vectors in every branch of the sequence above. They are not abstract IT hygiene issues. The clinical consequences of compromise are measurable and well documented in Canada.
Clinical Consequences Compound Across All Three Outcomes
Encryption halts clinical operations immediately. Peer-reviewed research links hospital ransomware events to increased in-hospital mortality, longer lengths of stay, and drops in stroke and cardiac care performance across neighboring facilities as patient load redistributes.
Exfiltration creates a longer tail of harm: regulatory enforcement under PIPEDA and provincial health privacy law, class-action litigation, medical identity fraud against individual patients, and the sale of PHI on markets where it is reused for insurance fraud and targeted phishing against vulnerable populations.
Destructive operations are the most dangerous of the three in patient-safety terms, because the goal is not leverage. The goal is to take clinical systems offline and keep them offline. An EHR restored from a week-old backup is missing medication orders, allergy updates, and recent imaging. A patient arriving unconscious in an ER has no usable history. The wiper does not need to hit every hospital in a network to achieve operational impact. One facility offline for even an hour during a regional mass-casualty event is sufficient.
The Cost
Healthcare is consistently one of the most expensive sectors in which to suffer a data breach. IBM’s Cost of a Data Breach report places the global average healthcare breach in the millions of dollars and the most expensive of any industry for the fourteenth consecutive year. The October 2023 attack on five southwestern Ontario hospitals cost roughly $7.5 million CAD in direct recovery over the following fiscal year. The Canadian Centre for Cyber Security reports that it issued 336 pre-ransomware notifications to Canadian organizations in 2024 alone, with an estimated economic saving of up to $18 million CAD to recipients who were able to act on those warnings. Ransomware-specific studies show mean recovery times of 21 to 26 days, with clinical downtime, revenue loss, and regulatory remediation costs compounding throughout that window.
The Ontario Information and Privacy Commissioner’s public investigation into the 2023 five-hospital attack specifically cited inadequate patch management, excessive data retention, and weak network segmentation as contributing factors. The remediation cost of eliminating a single cleartext protocol, decommissioning a legacy web front, or replacing an unpatched edge device is trivial against any of these outcomes. The reframing that aligns clinical leaders, executives, and security teams is the one that treats exposure remediation as a patient-safety priority rather than an IT backlog item.
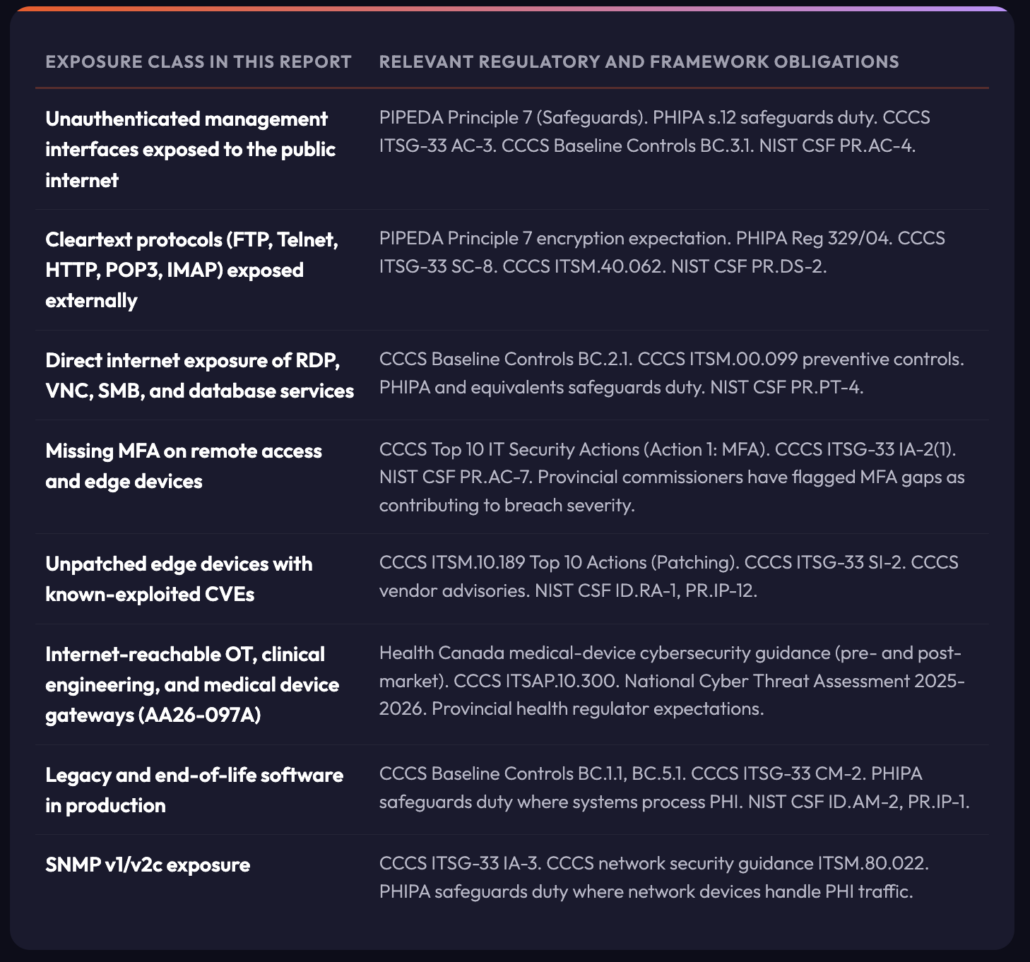
Regulatory and Framework Mapping
Exposure classes identified in this research map directly to obligations under PIPEDA, provincial health privacy laws (Ontario PHIPA, Alberta HIA, Quebec Law 25, British Columbia PIPA and E-Health Act, Nova Scotia PHIA), CCCS Baseline Cyber Security Controls, CCCS ITSM.00.099 (Ransomware Playbook), the National Cyber Threat Assessment 2025-2026, and ITSG-33 for federally regulated entities. The mapping below is indicative, not exhaustive. Legal and compliance teams should interpret specific obligations against their own authority of record, including Health Canada and the Office of the Privacy Commissioner of Canada.
Why this Methodology Matters
External exposure analysis answers a question that internal scanning cannot. It shows what an attacker sees from the open internet, with no access, no credentials, and no prior knowledge of the estate. This is the ground truth of the attack surface, and it routinely differs from the asset inventory an organization believes it has. Shadow IT, forgotten subdomains, abandoned cloud tenants, third-party hosted services, and misconfigured edge devices all surface through this lens before they surface internally.
What this Methodology Can Show
We can see the shape of a sector’s external attack surface at scale: internet-reachable services and how they are distributed across geographies and owning organizations, where legacy or end-of-life software remains in production, and where cleartext or deprecated protocols are still exposed. Edge devices and remote-access gateways that match products under active exploitation surface quickly, as do version strings that map to known CVEs. Patterns emerge that no single-organization view can produce, including concentration points where one fix addresses many hosts and the speed at which an adversary can enumerate and triage an entire sector in hours rather than weeks.
What this Methodology Cannot Show
We cannot see if any individual finding is actually exploitable. External banners say nothing about internal network posture, endpoint configuration, or user behavior, and they cannot measure compensating controls such as Web Application Firewalls, segmentation, or EDR. Patch state is particularly unreliable where enterprise distributions back-port security fixes and leave legacy version strings in place. The data carries no business context, no sense of data sensitivity, and no indication of clinical impact for a given asset. Assets reachable only over private circuits, VPN, or partner networks are invisible to this approach, and ownership attribution can mislead where hosting is shared, outsourced, or registered under a parent entity.
For these reasons the methodology is a starting point for triage, not a substitute for authenticated assessment.
The value is asymmetry. Adversaries already run this analysis continuously against every sector. A defender running the same analysis closes the visibility gap and prioritizes remediation where it matters most, which is anywhere a hostile party can see without asking permission.
A Guiding Question for Security Teams
This research was assembled from publicly indexed scan data. Any external party, including ransomware affiliates, initial access brokers, and state-aligned operators, can perform the same queries and reach the same conclusions in the time it takes to run a search. AA26-097A and the Canadian Centre for Cyber Security’s National Cyber Threat Assessment 2025-2026 both describe adversaries doing exactly this against critical infrastructure today. The defensive implication is unavoidable. Internet-exposed Canadian healthcare services are being enumerated and triaged by hostile parties on a continuous basis, right now, without any need for the adversary to touch the target environment.
The sector-wide view in this article is an average. It tells you what the Canadian healthcare footprint looks like in aggregate. It does not tell you what your external attack surface looks like. The single most important question this research raises is not answered in these pages:
What would a full external reconnaissance, run against your own organization tomorrow morning by a hostile party, reveal that this sector-wide view has not?
What Would an Adversary Find if They Ran This Query Against Your Organization Tomorrow?
An organization-specific exposure review can be completed non-intrusively within days: a prioritized remediation backlog mapped to the hosts, products, and services an adversary sees today.
Methodology
All findings are produced from passive service banner data. No active scanning, probing, authentication, or exploitation of any kind was performed against any host referenced in this article. No traffic was sent to in-scope assets as part of this analysis. The same class of data is freely available to any party with a browser or a scanner, including threat actors performing pre-attack reconnaissance.
Organizations are not named. Findings are aggregated to sector, province, and city level. Publishing asset-level data would hand adversaries a pre-sorted target list. Withholding it does not make the hosts safer, because the same data is available to any adversary willing to run the same queries, but it does avoid giving published amplification to a target list that an attacker would otherwise have to assemble independently. Defenders at named organizations can request a direct review against their own infrastructure.
Findings should be treated as indicators, not confirmed exploitable conditions. Remote vulnerability detection relies on banner fingerprinting, version strings, and service behavior, all of which can be inaccurate. False positives are expected. The following conditions in particular produce false positives and should be considered when triaging:
- Back-ported security patches in enterprise Linux distributions preserve old version strings after the vulnerability is fixed.
- Web Application Firewalls and reverse proxies terminate external traffic and may mask or misrepresent the actual origin server.
- Load balancers and CDNs share banners across many backend services.
- Some fingerprints rely on default content or error messages that do not reflect real service state.
- Organization and location attribution is based on autonomous system registration, reverse DNS, and certificate metadata, which can be inaccurate or stale.
- Historic scan data can persist in public indexes after a service is taken offline.
No finding in this report should be treated as confirmed exploitable without authenticated validation against authenticated scanning, asset inventory, and patch records.
Research Summary