By Estelle Ruellan, Threat Intelligence Researcher
In the era of logging-in rather than hacking-in, infostealers have rapidly become the star of the cybercrime show. With the sheer volume of stealer logs being shared on the underground scene, it’s a struggle to keep track of trends, tactics and campaigns.
We analyzed 50,000 infected devices to understand the tactics used by threat actors.
Key Takeaways
Infections revealed distinct patterns in how threat actors craft their traps to maximize the number of victims:
- We found that 41.47% of people in our study were infected through a gaming-related file (such as fake Roblox, etc). This is a staggering number that shows the risk of downloading pirated games.
- In addition, across all infections, 17.65% involved the victim downloading a “crack”/”cracked” version of the targeted entity, which made “crack” the most common claimed functionality in the study*
*This is an undercount, as many pirated or modified files don’t explicitly mention being a “crack,” and behaviors around pursuing piracy, unauthorized modification, and unofficial updates, are greater than these numbers represent.
These trends reveal that threat actors are laying these infostealer malware traps after careful plotting.
They are preying on the gap between what kind of software that people want, and what they’re willing to pay for.
By offering free versions as bait, and tailoring their lures to each online ecosystem, ranging from cracked creative tools to unofficial gaming mods, threat actors are exploiting the simple economic reality that online communities value low or no cost software.
The consequences for a victim of an infostealer malware infection vary, and can include:
- Identity theft
- Psychological damages (stress from being hacked and the outcomes of it)
- Financial loss (if credentials for a financial institution are stolen)
- Breached privacy (photos, files, and personal habits can be exposed)
Though legitimate software can be more expensive than “cracked” free versions, getting hacked can be much costlier.
Keep reading for more information or check out the video analysis here:
Methodology
Black Hat USA 2025 was the scene where we first presented LLMs as part of a solution to tackle the infostealer problem. Using artifacts from the logs themselves, screenshots taken at the moment of the infection, LLMs can help us identify why and how infections happen. Using this method, we analyzed the infections of 50,000 infected devices to understand the lure and tactics used by threat actors to infect as many people as possible.
Data
The 53,896 infected devices in our sample were infected between June 7th, 2025 and August 12th, 2025. The logs in our sample were infected by four distinct malware families: Lumma, StealC, Nexus and RedLine. The remainder of our sample was not related to any families so we labeled it “unknown.”
| Family | # Infected Devices | % of Sample |
| Lumma | 38,759 | 71.9% |
| StealC | 5,614 | 10.4% |
| Nexus | 934 | <2% |
| RedLine | 403 | <1% |
| Unknown | 7,857 | 14.6% |
When analyzing these infections, we identified two key dimensions that define each infection’s narrative:
- Targeted Entity
- Claimed Functionality
The targeted entity represents the brand, software, or game that the malware impersonates. For instance, if a user becomes infected after downloading a file labeled “GTA V Mod Menu,” the targeted entity is the video game Grand Theft Auto V (GTA V).
The claimed functionality, on the other hand, is the lure, the feature or benefit the attacker promises to entice users into downloading the malicious file. In the example above, the “Mod Menu” is the claimed functionality, serving as the bait that convinces the victim to install the malware.
By viewing infections through these two dimensions, we can begin to see patterns in how attackers choose their disguises. A closer look at the targeted entities reveals a great deal about threat actors’ strategies.
Targeted Entities: What Infected Software Did Users Download?
Infections were distributed across 9,303 unique targeted entities. For analysis, these entities were organized into seven primary categories based on their function and user appeal:
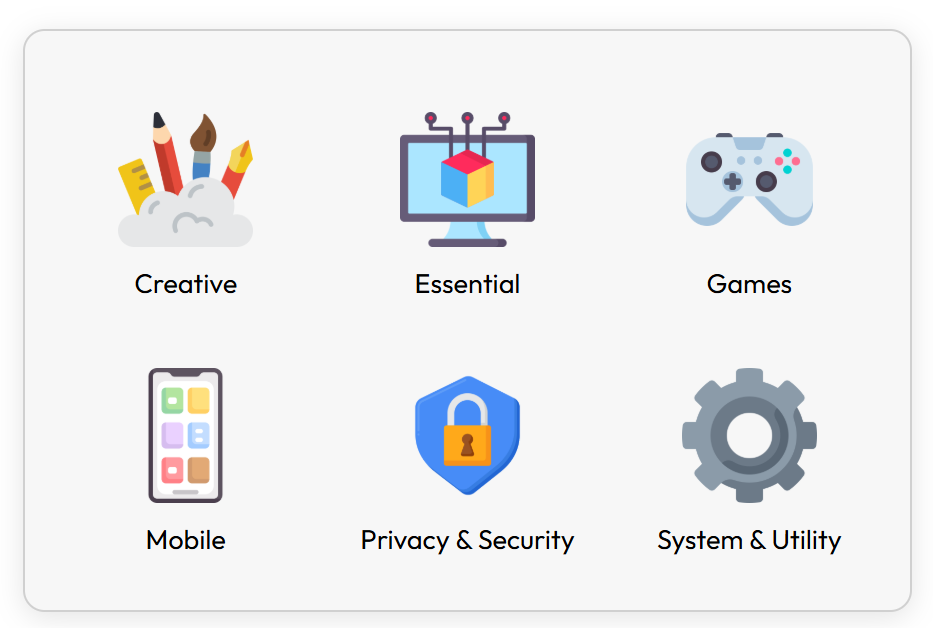
Infections are distributed across the targeted entities of creative, essential, games, mobile, privacy & security, and system & utility
1. Games
Video games and gaming platforms.
Examples: Fortnite, Minecraft, FIFA, CS GO, Steam, Roblox, Call of Duty
2. Essential Software
Operating systems, office suites, and productivity tools used for work, business, or document creation. These represent high-value, trusted brands that many users regularly interact with.
Examples: KMS tools, Microsoft Office, Windows, macOS, LibreOffice
3. System & Utility Tools
System optimization, file management, and driver utilities.
Examples: WinRAR, Driver Booster, 7-Zip, disk utilities
4. Creative
Applications for creative work, including design tools, music production, and video editing.
Examples: FL Studio, Blender, AutoCAD, DaVinci Resolve, GIMP
5. Security & Privacy
Software designed to protect user data, devices, and online activity, including VPN, privacy tools, antivirus programs, and anti-malware utilities.
Examples: CyberGhost, CCleaner, NordVPN, Malwarebytes, Kaspersky
6. Mobile Device Software
Phone management tools and mobile utilities that target smartphone users or provide cross-platform device management.
Examples: Samsung utilities, iTunes, Android tools, phone unlocking utilities
7. Others
Entities that did not clearly fit into the categories above, including niche software or uncommon tools.
When looking at the categories of entities being targeted, Games clearly take the lead, accounting for more than half of all unique entities, 4,569 in total. System & Utility and Creative follow, with 1,428 and 1,205 entities respectively. Categories like Mobile, and Essential have moderate representation, while Privacy & Security entities barely make a mark, with just 75 unique entities.
Number of unique targeted entities and infections by category (hover over the bars to see exact numbers)
When we break down infections by category of targeted entities, one area clearly dominates: Gaming. 41.47% of infections in our sample were linked to gaming (with over 22,000 infections), more than any other category. System & Utility software comes in second, closely followed by Essential and then Creative software.
To put it in perspective: roughly 2 out of every 5 people in our study were infected through a gaming-related file. That’s a striking reminder of how much risk can hide behind pirated games.

2 out of 5 people in our sample were infected by a gaming-related file
The sunburst diagram below shows how infected devices are spread out by category and by specific software. The inner circle shows each category’s share of infections, while the outer circle breaks it down into the exact apps, software or games behind those numbers.
A closer look reveals clear leaders within each category (in order of number of infections):
- Games: GTA, Roblox, Valorant, Counter-Strike: Global Offensive (CS:GO in the chart), and Fortnite are the top five sources of infections
- Essential Software: KMS, Microsoft and Windows dominate the infections here
- System & Utility: Internet Download Manager accounts for the majority of infections
- Creative Software: Adobe overwhelmingly leads in this category
The sunburst showcases how some software and games are clearly way more successful at spreading infections than others.
Sunburst diagram of lures for infection (hover over each section to see the exact count)
Targeting Unique Characteristics of the Online Gaming Community
Gaming represents the perfect hunting ground for threat actors. Unlike other software categories, the gaming ecosystem actively fosters communities where unofficial modifications are not just accepted but encouraged. Since game publishers consider most modifications illegal, there’s no legitimate source for “verified” cheats or mods. This creates an environment where malicious software can masquerade as legitimate gaming enhancements with minimal scrutiny. When a downloaded “mod menu” doesn’t work, users typically assume it’s faulty and move on to find another one, not suspecting malware infection.
This overall targeting pattern reveals a calculated strategy: threat actors consistently target household names like Adobe, Microsoft Office, or GTA and Roblox because universal recognition equals maximum reach. This global recognition ensures a large pool of potential victims, spanning countries, languages, and demographics. The strategy becomes even more effective because mainstream software often comes with costly licenses, pushing users toward illegal alternatives that attackers can exploit.
Claimed Functionalities: What Feature Did Users Hope to Gain?
Infections reveal clear trends in how threat actors tailor their traps to different software ecosystems to attract the most victims. Across all infections, 17.65% explicitly involved a “crack” or “cracked” version of the targeted entity. This means that roughly 1 in 6 people in our sample was infected by a “crack” of the targeted entity. This makes “crack” the single most common claimed functionality we observed.

1 in 6 people in our sample were infected by a “crack” of the targeted entity
Claimed Functionalities by Percentage
| Claimed Functionality | Percentage of Infections |
| Crack | 17.65% |
| “Versions” | 12.75% |
| Activation Bypasses | 9.84% |
| Cheats | 9.08% |
| Mod Menus | 8.54% |
Looking at the full dataset, claimed “versions” of the targeted entity were mentioned in (12.75%) of infections and takes second place in number of infections. Activation bypasses (ex. “Activation” and “Activator”) follow closely with 9.84% of infections, while cheats (9.08%) and mod menus (8.54%) round out the top five. This suggests that piracy-related searches (“crack,” “activation,” “repack”) and version-related keywords (“version,” “build,” “patch”) remain the most fertile ground for threat actors across all targeted entities.
These numbers reveal a fundamental understanding of human nature: people want premium products without premium prices. Threat actors have built entire operations around this basic economic principle, turning users’ cost-saving instincts into their primary attack vector.
Trends by Category of Software
Breaking the data down by category of targeted entity reveals interesting patterns. While most infections in Creative, Essential, System & Utility, and Privacy & Security software mirror the overall trends, Gaming-related infections chart their own course, targeting cheats, mod menus, and hacks that give players a competitive edge or cosmetic upgrades
Breakdown of targeted entities (hover over each category to explore the percentage of claimed functionality by category)
Nearly one third of Creative related infections were due to a “cracked” Creative software (32.72%), and another fifth (18.62%) of Creative infections were associated with a specific “version” of the Creative software.
For Essential and System & Utility related infections, activation bypasses were the strongest lure (29.25% and 26.13%, respectively).
Even tools designed to protect users, such as antivirus programs and VPNs, are being turned against users: over a quarter (25.86%) of Privacy & Security infections involved a “cracked” version of the targeted software. This represents perhaps the most perverse targeting strategy: users seeking protection often download “cracked” antivirus programs, inadvertently installing the very threats they’re trying to avoid. Attackers exploit the urgency and trust associated with security products, knowing users act quickly when they believe their systems are at risk.
These numbers show how threat actors are exploiting the high cost of essential, creative or security tools and capitalize on users’ willingness to bypass the legitimate licensing fees, sometimes at the cost of their very own security. “Cracks,” “activation bypasses,” and “versions” are the most common tricks, but even simple terms like “build” and “patch” are being weaponized.
However, the Games category shows a different functionality landscape. “Cheats” (21.44%) and “mod menus” (20.21%) top the list, followed by “hacks” (11.30%). On top of “mod menus,” gaming related entities are the host of many gaming-specific claimed functionalities such as “aimbot,” “skin swapper/changer,” or “wallhack.” This underscores a unique tailoring: threat actors focus on the competitive edge and aesthetic looks gamers seek such as performance hacks, exploits, and customizations, rather than piracy alone.
But these numbers are a minimum baseline: many pirated or modified files don’t explicitly mention being “cracked” or “repacked”. The percentages reported only reflect explicit mentions of the claimed functionalities in filenames or infected files. These functionalities keywords represent explicit signals, but the underlying behaviors (ex. piracy, unauthorized modification, and unofficial updates) are more pervasive than raw percentages show.
Together, these patterns reveal the calculated precision behind what might appear to be opportunistic attacks.
Reckoning with the Risks of Downloading Unofficial Software Versions
Threat actors are not spraying random baits, they are deliberately aligning their strategies with what each online community values most. And it works. In 2024 alone, at Flare we have observed more than 34 million infostealer logs being shared on the underground scene. This staggering success stems from exploiting a simple economic reality: the gap between what people want and what they’re willing to pay for. Whether it’s a $100/year Microsoft Office suite or a $28.99 PC game, threat actors position themselves in that exact gap.
The solution isn’t just awareness, it’s understanding that in ecosystems where unofficial enhancements are culturally accepted (like gaming) or economically motivated (like expensive software licenses), the risk landscape fundamentally changes. Always download from official sources when possible. Yes, legitimate software is expensive, but as these 50,000 infections prove, getting hacked costs much more.
Monitoring Stealer Logs with Flare
The Flare Threat Exposure Management solution empowers organizations to proactively detect, prioritize, and mitigate the types of exposures commonly exploited by threat actors. Our platform automatically scans the clear & dark web and prominent threat actor communities 24/7 to discover unknown events, prioritize risks, and deliver actionable intelligence you can use instantly to improve security.
Flare integrates into your security program in 30 minutes and often replaces several SaaS and open source tools. See what external threats are exposed for your organization by signing up for our free trial.