
By Adrian Cheek, Senior Cybercrime Researcher
On August 22, 2026, The Telegraph reported that a small UK power generator had been shut down for four days in July following a cyberattack by hackers linked to Iran. The government confirmed that a small-scale energy generator was affected, said the wider energy system was never at risk, and declined to identify the site. The incident was reported to the National Cyber Security Centre, and the Department for Energy Security and Net Zero briefed energy company chief executives and sent guidance to businesses.
Within days, researchers began examining internet-wide scanning data for exposed industrial control protocols and publishing counts of what they found. The exercise is reasonable, but the assumption that the resulting numbers describe a single, measurable population is not.
Over one month, we ran 17 passive collections across three internet-wide scanning platforms, covering eight industrial protocols and three cellular access vendors, and consolidated 113,269 service records into a dataset of 65,287 addresses. Of these, 1,030 addresses are in the UK.
On TCP port 502 in Britain, a protocol-scoped query returns 427 service results across 426 addresses that respond to Modbus. A product-scoped query on a different platform returns four devices that name themselves. Both queries are correct, both are the kind of query a professional would write, and the answers differ by a factor of one hundred.
The difference is not error. Modbus device identification is an optional function code, so a device can answer the protocol perfectly while refusing to say what it is. One query asks what a device says. The other asks what it is. In Britain, those two questions have answers two orders of magnitude apart.
An internet-wide exposure count is not a measurement of how many devices are exposed. It is a measurement produced by a particular query, platform, fingerprint set, observation window and exclusion methodology.
Applying a consistent method across all three platforms, and removing 466 hosts that are not what they appear to be, the United Kingdom holds 564 internet-reachable industrial and industrial-access hosts across five device layers. That figure will not match the counts published. Understanding why is the substance of this article.
Headline Figures
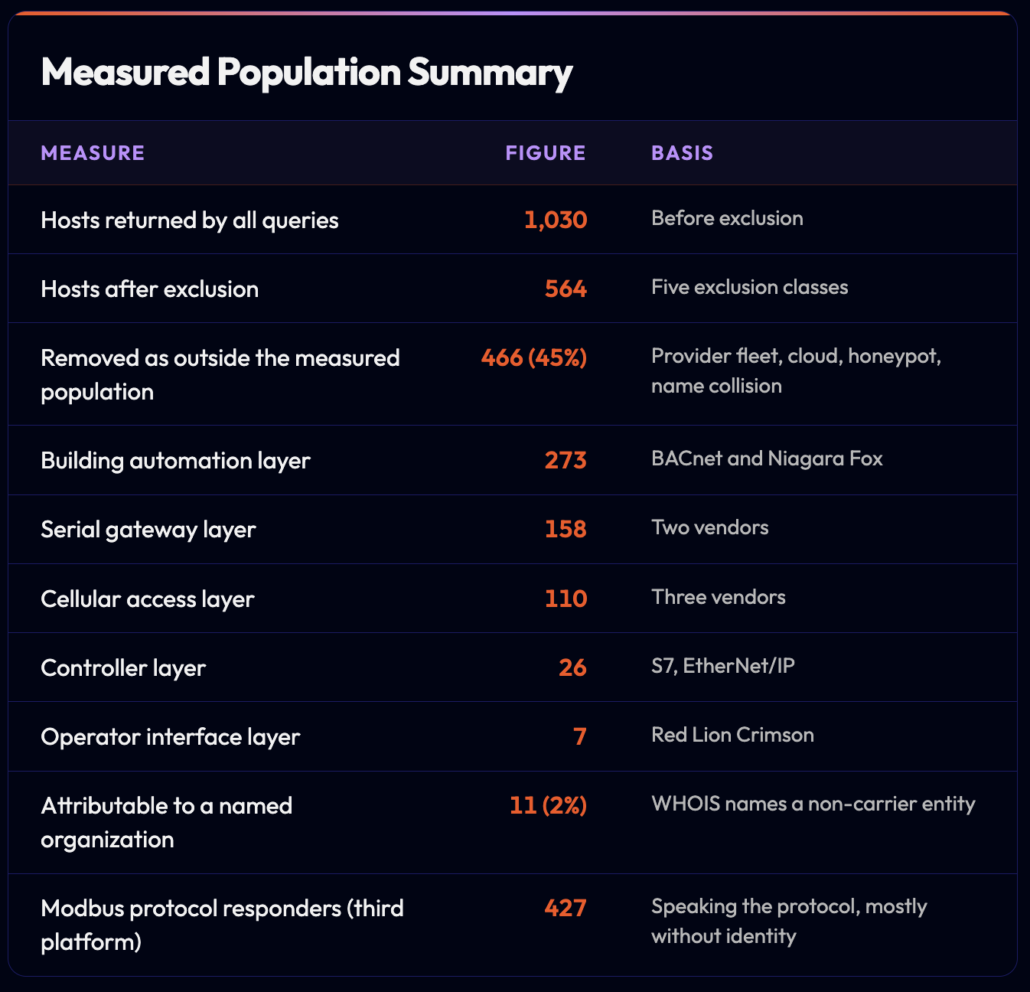
Table 1. All figures are floors. Each is a count of addresses observed responding within a one-month window. Devices behind carrier network address translation, on uncrawled ports, or answering without identifying themselves are not represented.
Key Findings of Internet-Exposed Infrastructure in the UK
- Counts are query-dependent. On one port in one country in one week, a protocol-scoped query returned 427 service results and a product-scoped query returned four devices. What can be counted is determined by which protocols self-identify, not by which devices are exposed.
- Device fingerprints contain substantial synthetic exposure, and the fraction is not uniform. Three quarters of one labeled Schneider population was classified by the platforms’ exclusion signals as simulated, cloud-hosted or otherwise non-genuine for the purposes of this measurement, and for one access vendor the rate was 17% globally against 76% in Britain. No single correction factor can be applied.
- No single scanning platform provides complete visibility. Across four device classes the coverage gap ran in both directions, determined by vendor and by transport. One access vendor is not enumerable at all on the platform most exposure counts are built from.
- Access infrastructure materially expands the observable attack surface. Britain holds 26 exposed controllers and 383 exposed access and building automation hosts. The controller layer addressed by many current OT advisories is substantially smaller than the access and building-automation layers visible from the public internet.
- Attribution is far harder than identification. Eleven of 564 British hosts, or 2%, can be attributed to a named end organization from passive data. Identifying a device is not the same as establishing who operates it.
Flare Academy Discord Community
Get the Latest Cybercrime Research
The Flare Academy Discord is where security practitioners and threat researchers break down findings like this one. Join the conversation and connect with the community working on these issues daily.
Key Judgments
High Confidence
- The exposed controller population in the United Kingdom is small, in the low tens, and the exposed access and building automation layers are more than an order of magnitude larger in the observed dataset. This holds across three platforms and eight protocols. Counts of exposed Modbus devices are not comparable between studies unless the query form is stated. The protocol-scoped and product-scoped answers for Britain differ by a factor of one hundred. Any UK exposure figure published without a per-country exclusion pass overstates the population substantially. Forty-five percent of the raw national result set fell outside the population being measured, against roughly 17% globally for the same fingerprints.
Moderate Confidence
- The British access layer sits predominantly behind IoT connectivity resellers rather than general ISPs. Five providers hold 140 of 564 hosts and nearly all of the cellular component, but reseller address space is not always distinguishable from carrier space by WHOIS alone.
- The 61 of 67 non-overlap on mobile carrier space reflects intermittent reachability and differing scan cadence rather than address churn. Prior device-identity analysis rules out churn, but we did not observe these specific addresses over time.
Low Confidence
- That 564 is a stable figure. It rests on one observation window, five further Schneider product strings remain uncollected, and one access-layer vendor is not enumerable on the primary platform at all.
The judgments below state what we believe the evidence supports and at what confidence. The sections that follow set out the evidence for each.
What the UK Actually Holds
The collection covered eight industrial protocols and three cellular access vendors across three scanning platforms. After deduplication and exclusion, the UK population divides by layer as follows.
UK Exposure by Layer and Technology
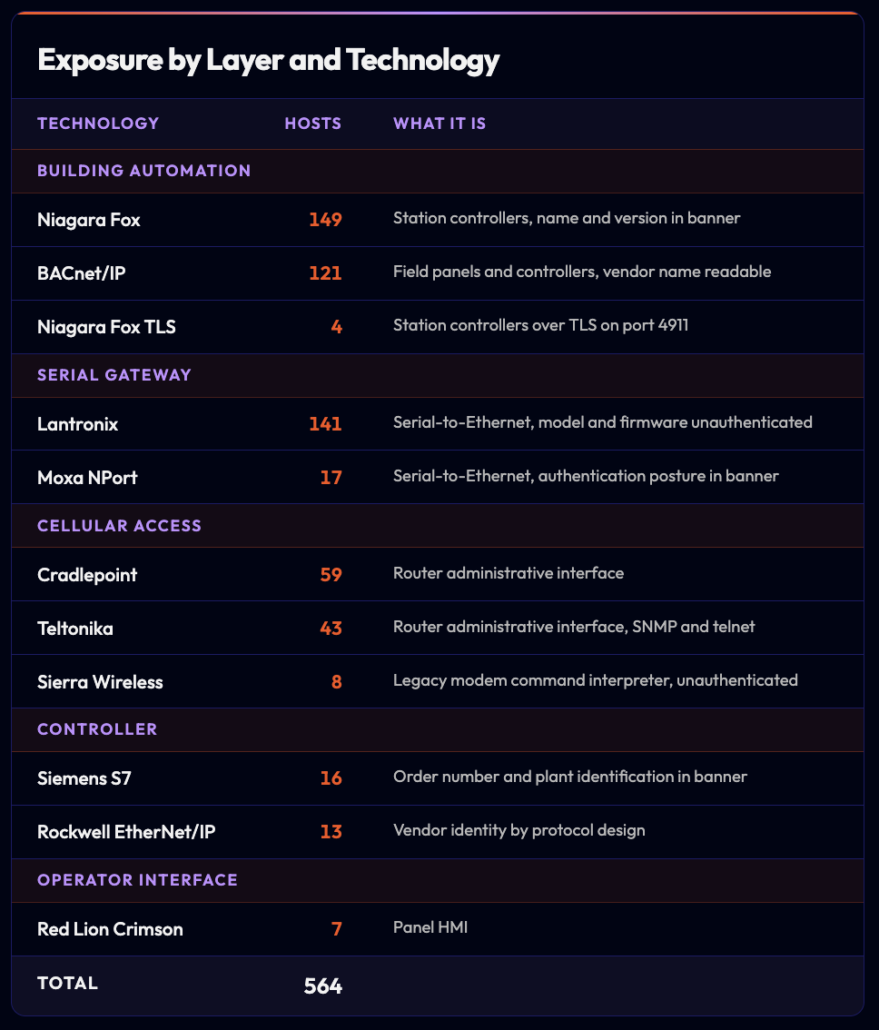
Table 2. Technology rows are not additive in two ways. The rows sum to 578. Four addresses answer two technologies within a single layer, three in the controller layer and one in building automation, giving 574 layer instances. Ten further addresses are represented in more than one layer, five combining building automation with a controller, four combining cellular access with building automation and one combining a controller with an operator interface. The national total is the deduplicated address count of 564.
Provider Concentration
The provider concentration is equally clear. BT Infrastructure Layer holds 102 hosts, TalkTalk 32, and Zen 9. The access layer sits somewhere else entirely: Wireless Logic 73, Jola Cloud Solutions 27, Mobile Broadband Service 21, iBasis IoT Europe 10 and Globalgig 9. These five are IoT connectivity resellers and SIM aggregators rather than consumer or business ISPs, and between them they hold 140 of the 564 hosts and nearly all of the cellular component. A further 46 hosts sit on smaller providers of the same type.
That matters operationally. A device on an IoT reseller SIM sits on a shared carrier network, and its exposure profile is set by the reseller’s access point configuration rather than by the organization that bought it. The operator frequently does not know the device is reachable, because it was installed by an integrator and never entered an asset inventory.
427, or 4?
Port 502 is the Modbus port and the one most exposure reporting reaches for. In Britain it returns two entirely different answers depending on how the question is asked.
A protocol-scoped query on a platform that performs a real Modbus handshake returned 427 service results across 426 addresses on August 23, 2026. A product-scoped query on a second platform, restricted to the Schneider product strings that dominate the global labeled population, returned four devices after exclusion.
We re-ran the protocol-scoped query on August 24 as a verification step. It returned 428 service results across 427 addresses. The single additional result sits on a commercial cloud provider in the London region and returns a Schneider controller identity that the platform’s own honeypot filter did not exclude. One observation is not a measurement of drift, and we make no claim about the rate at which this population moves. It does establish that the figure is a reading taken at a moment rather than a property of the country, which is the point of this section.
In the British data, the most common Modbus response by far is an illegal-function error, which confirms a live Modbus stack and discloses nothing else. One host in the visible sample returned a Schneider power meter identity on an IoT reseller network. The other 425 are equally reachable and equally silent about what they are.
Those devices are real, reachable, and countable by protocol. They are invisible to any query that asks for a product name.
The distinction is not a technicality. A defender reading that four Modbus devices are exposed in the UK concludes the problem is negligible. A defender reading 427 concludes it is significant. The underlying observation is that several hundred internet-reachable addresses in Britain responded to an unauthenticated Modbus request during the collection window, and a handful of them disclosed a model number.
The same effect appears on port 102. A product-scoped query returns no Siemens devices anywhere in the world, across 465,740 records, because the platform does not map the identification response into its product field. A banner-content query for the Siemens order-number prefix returns 4,212 globally and 13 in Britain. Reading the first as an absence of devices would be a serious error, and it is an easy one to make.
45% of the British Result Set Does not Represent the Population being Measured
The exclusion rate in the UK is more than double what the same fingerprints produce globally, and the composition explains why.
Exclusions Applied (UK)
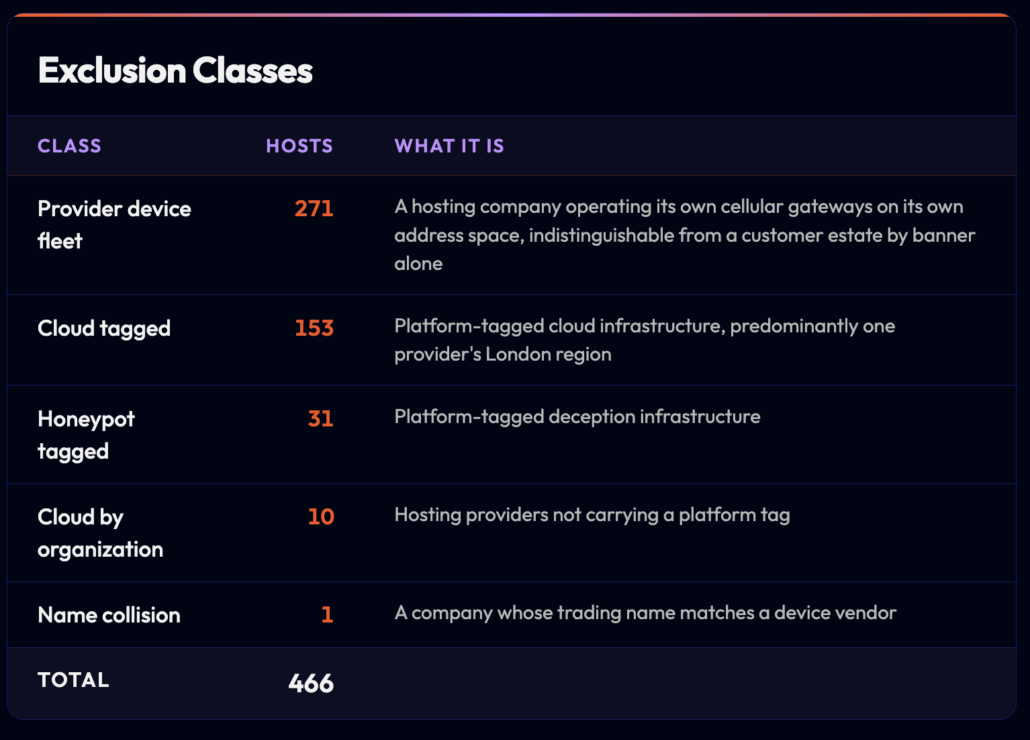
Table 3. The middle three classes come from the collecting platforms’ own tags and require no analyst judgment. The first and last were established by inspection during this work. Exclusion does not mean the hardware is fictitious: the provider fleet is real equipment, removed because it is one hosting company’s own product rather than part of the customer estate this article sets out to measure.
The provider fleet class is new and worth describing, because it appears in no published exclusion methodology. 271 hosts in Britain returned a genuine cellular gateway banner, running a current kernel on real ARM hardware, and would pass any honeypot test. They sit across 72 subnets belonging to one hosting company, all answering SNMP, all the same model, all carrying the vendor default administrative contact address. They are that provider’s own connectivity product, not 72 customer sites.
Left in, they would have made a single hosting company the largest holder of exposed industrial access equipment in the United Kingdom by a wide margin: 271 hosts against 102 for the next largest, and 32% of a national total of 835. Any sector breakdown built on that total would have been materially distorted.
The Space that Changes the Answer
Published work on industrial honeypots reports global rates. One study using a single scanning platform over 2024 found that roughly 15% of visible industrial devices appeared to be honeypots in April 2024, rising to 25% by January 2025. Our data is consistent with that as a global figure and inconsistent with it as a national one, and the reason is visible in a single product family.
We collected the five largest Schneider product strings on port 502 and applied the collecting platform’s own honeypot and cloud tags.
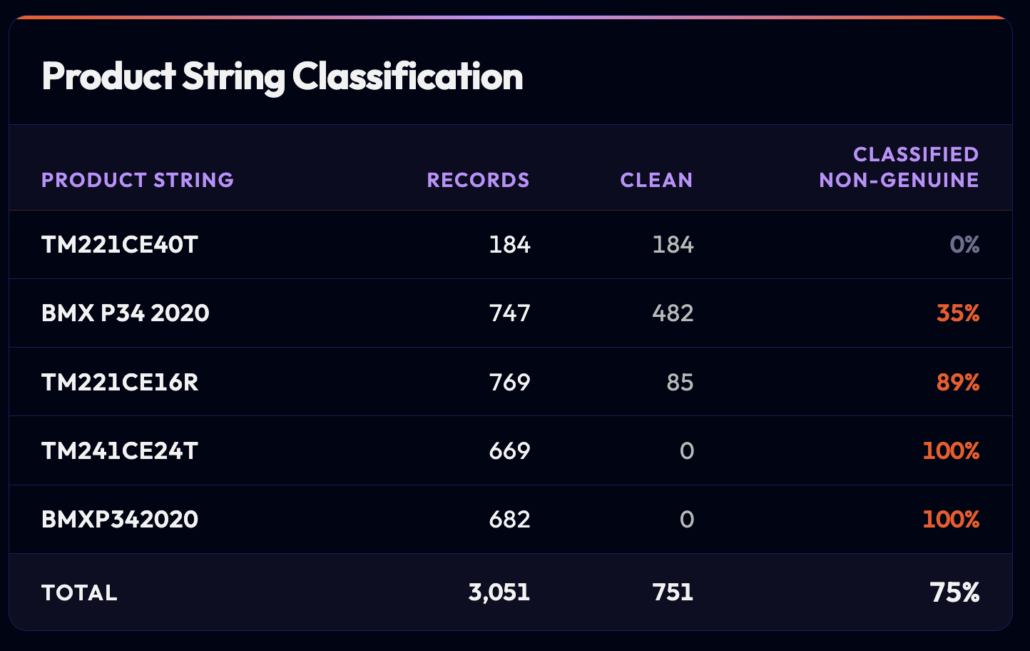
Table 4. Classification is by the collecting platform’s cloud and honeypot signals, not by independent verification. Two of five product strings contain no host that survives those signals anywhere in the world.
“BMX P34 2020” is 65% clean. “BMXP342020” is 0% clean. These are the same Modicon controller rendered two ways. Normalizing product-string variants before counting is ordinary and defensible practice, and here it would merge a real population with a synthetic one and report the sum. Where a device appears under several product strings, check the exclusion profile of each string before merging any of them.
The geographic point follows from the same mechanism. For one cellular router vendor the emulated share of the Canadian result set was 15.6%, and for the same vendor in Britain it was 76.8%, with the British emulators hosted in British cloud regions so that a country filter does not remove them. For that vendor, a per-country exposure count published without a per-country exclusion pass would overstate the classified population in Britain by roughly three and a half times, from the same query on the same day. The same vendor in Canada would be overstated by less than a tenth.
What a Single Platform Cannot See
Most exposure reporting is built on one scanning platform. Across four device classes in Britain, the coverage gap ran in both directions, with the direction set by the vendor and by the transport.
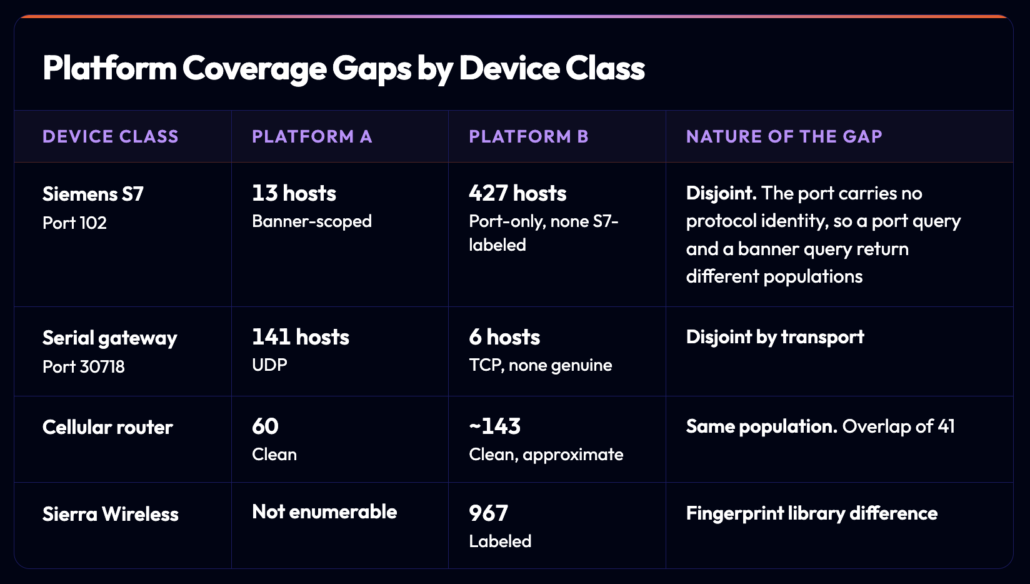
Table 5. Only one of four comparisons is a numerical disagreement. The others are structural, meaning the two platforms are not observing the same population. The 427 figure in row one is a host count on port 102 from Platform B and is unrelated to the port-502 Modbus figure in section 2, which stood at 427 service results on the same day and at 428 on re-run the following day. Both were read from the platforms directly.
The Sierra Wireless result deserves emphasis, because we relied on that vendor’s prevalence in our own earlier work. Five separate fingerprints on the primary platform returned nothing usable: the management interface name returned nine records worldwide, the vendor product filter and the page title filter returned nothing, the operating system name appeared zero times in 362 records of a related query, and the default management port returned 319,568 records with a geographic distribution unrelated to cellular routers. The second platform labels 967. The devices exist and one platform cannot find them.
When an Address is not a Device
The cellular router comparison produced the most consequential result in the British data. Of 67 devices the second platform found on United Kingdom mobile carrier ranges, six appeared anywhere in our entire 113,269-record dataset. 61 were absent from the first platform completely: not on a different port, not under a different fingerprint, simply not present.
We first attributed this to port scoping and were wrong. Removing the port scope and repeating the collection returned an identical result. Our earlier work established that these devices hold sticky carrier addresses rather than moving between them, so address churn does not explain it either. One explanation consistent with the observations is intermittent reachability combined with differing scan cadence: a device whose link comes and goes may be captured by whichever platform swept while it was up.
A scan of carrier address space measures address observations, not devices.
This places a caveat under every carrier-attached figure in this article and in the wider literature. It applies with particular force to the access layer, which is where the majority of observable OT exposure sits, and it means that a single clean scan of a cellular estate is weak evidence of anything.
The Evidentiary Value of a Signal Depends on Where it Sits
A common and sensible practice is to treat two independent indicators on one address as raising confidence. Our dataset contains 1,517 such addresses globally after collapsing cases where one service was observed on two ports. Every one of them falls into exactly one signal combination, so the groups below sum to the total. 1,206 carry an access-layer signal alongside an industrial one and 311 carry two or more industrial signals with no access device present. Three patterns account for most of the population, and the third inverts the rule.
- Building automation co-residency, 1,185 addresses. A cellular router and a building control platform on one address in 982 cases, or a building controller answering two protocols. Frequently one physical device speaks to both, so the two indicators are not independent.
- Field cabinet pairings, 53 addresses. An operator interface and a controller behind one connection, 45 of them on two North American carriers and appearing in contiguous address runs. These are genuine and are the most attributable population in the dataset.
- Hosting-provider co-residency, 21 addresses. Two or three industrial protocols on one address, on hosting infrastructure rather than carrier or broadband space, and not tagged as simulated by the collecting platform. This is 1.4% of the multi-signal population, and 12 of the 21 sit on a single large hosting provider, so it is an observation rather than a measured rate.
The third group is the finding, and it is a small one. A simulator is built to look maximally like a device, which means it presents more indicators than a real device does. Applied without an infrastructure filter, a multi-signal confidence rule would promote exactly these addresses to the top of any ranking. At twenty-one addresses this is a mechanism worth naming rather than a rate we can quote.
The evidentiary value of an exposure signal is conditional on infrastructure context. Two protocols on one address raise confidence on carrier and broadband space, and lower it on hosting space.
This generalizes beyond industrial protocols. Any scoring model built on external observation, including the kind that ranks organizations by exposure, inherits the same defect unless infrastructure context is a term in the model rather than a filter applied afterwards.
Identification is not Attribution
11 of the 564 British hosts, or 2%, sit on address space whose WHOIS record names an end organization rather than a carrier or hosting provider. The rest are absorbed by their connectivity provider.
We do not publish the 11, as naming them would produce a targeting list at the exact moment the sector is under attention, and the aggregate is the finding: external exposure data cannot support organization-level conclusions at national scale, however precise the device identification becomes. Organization-level claims based solely on scan data therefore require either independently established attribution or an explicit acknowledgment that ownership is inferred rather than established.
This is also why we make no claim about the generator that was shut down. We do not know which site it was, we have not attempted to identify it, and a correct identification would point at infrastructure that may still be compromised while an incorrect one would name an organization that was never attacked.
Where the Exposure Actually Sits
26 controllers. 273 building automation hosts. 110 cellular routers. The controller layer addressed by many current OT advisories is substantially smaller than the access and building-automation layers visible from the public internet. In Britain, those layers contain hundreds of observable hosts while the controller layer remains in the low tens.
We have now measured this distribution twice, in two hemispheres, using different collections. In a Pacific regional sweep run against a Siemens advisory, the controller layer was absent entirely while the access layer was present at scale. In Britain, the controller layer exists but is in the low tens while the access and building layers are in the hundreds.
The practical consequence is that an exposure program scoped to the phrase “search for exposed PLCs” will measure the smallest observable part of the problem while potentially overlooking the larger access layer. The cellular router in front of the controller is more likely to be reachable, more likely to have a web interface, more likely to have been installed by a third party, and less likely to appear in an asset inventory. The building controller is more numerous than either.
This is also the structure described in a recent industrial intrusion for which a detailed public account exists, in which the entry path ran through remote access and a cellular bridge and reached the controllers only at the end. We do not claim the incident that prompted this work followed that path. No public account establishes that it did, and nothing in this article should be read as evidence either way.
ATT&CK for ICS
A passive census observes preconditions rather than adversary activity. One technique is evidenced by this dataset and we claim no others.
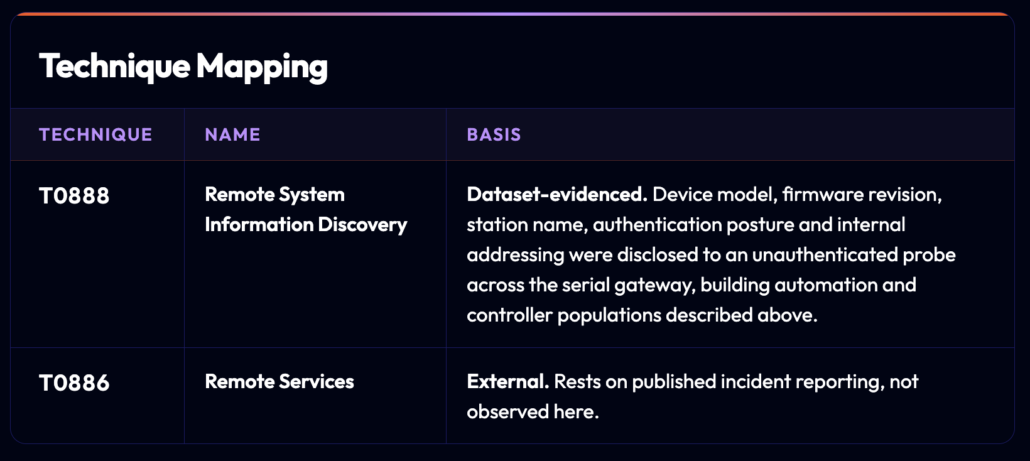
Table 6. Command and control techniques are excluded deliberately. A census measures what is reachable, not what an adversary did, and mapping discovery data to execution techniques would be a category error.
Exposure Management Recommendations for Security Teams
- Ask what query produced the number. Port-scoped, protocol-scoped and product-scoped answers to the same question differ by orders of magnitude, and none of the three is wrong.
- Do not read a product-query null as an absence of devices. Confirm with a protocol-scoped or banner-content query before concluding a device class is not present. A global product query for Siemens S7 returns nothing, and there are thousands of them.
- Use more than one platform. Where two disagree, establish whether the gap is coverage, transport or fingerprint before treating either figure as the estate. Neither platform contains the other.
- Apply exclusions, and apply them per country. The synthetic fraction moves from 17% to 76% between two countries for one vendor. A global adjustment factor will be wrong in both places.
- Do not treat carrier observations as stable device counts. Check on more than one day. A single clean scan of a cellular estate is weak evidence, and roughly half of one such population was not permanently reachable in earlier work.
- Examine the access layer, not only the controller layer. In Britain the cellular access layer holds 110 hosts against 26 controllers, and building automation holds a further 273, so the two layers together are roughly fifteen times the controller population. Ask integrators which cellular-connected devices they installed and which SIMs or carrier services they use, because those assets rarely appear in an internally generated inventory.
The Gap in Numbers and the Findings that Shake Out
Britain has somewhere in the region of 564 internet-reachable industrial and industrial-access hosts, of which 26 are controllers and 11 can be traced to a named organization. Every one of those numbers is a floor, produced by a specific query on a specific platform in a specific month, and every one of them would change if any of those three things changed.
That’s not a failure of the method. It is the method’s actual output, and reporting it honestly is more useful than reporting a single confident figure. The 427-versus-four gap on port 502 is not an anomaly to be resolved but a permanent property of measuring devices that are under no obligation to identify themselves. The 45% exclusion rate is not noise to be filtered once and forgotten but a per-country variable that moves from 17% to 76% depending on where the simulators happen to be hosted.
Two findings survive all of that uncertainty and are worth acting on. The first is that the exposed controller population is small while the access and building automation layers around it are an order of magnitude larger, which means an exposure program scoped to PLCs is looking at the least of the problem. The second is that identification and attribution are different exercises, and 2% attributability at national scale should end any expectation that scan data alone can tell you which organizations are exposed.
What this article cannot tell you is whether any of it persists. Every figure here comes from a single month-long window, which measures breadth but not time, and cannot separate a transient exposure from a permanent architectural condition. That is the next collection, and until it exists, no forward-looking claim should be built on data of this shape, including ours.
Flare Academy Discord Community
Get the Latest Cybercrime Research
The Flare Academy Discord is where security practitioners and threat researchers break down findings like this one. Join the conversation and connect with the community working these issues daily.
Methodology and Limitations
All collection was passive. We queried three commercial internet-wide scanning platforms and analyzed the records they returned. No target system was contacted, probed or authenticated to by us, and no interaction beyond the platforms’ own standard collection took place. No organization is named, and the attributable subset is deliberately withheld.
17 collections ran between July 24 and August 23, 2026, producing 113,269 service records across 65,287 unique addresses globally, of which 1,030 addresses are in the UK. Records were consolidated to address level. Exclusions were applied in the five classes shown in Table 3, and excluded hosts are retained in the dataset with a reason code, because the size of the excluded population is itself a finding.
Classification of hosts as non-genuine relies on the collecting platforms’ own cloud and honeypot signals, supplemented by two classes we established by inspection. We did not independently verify that any individual host is a honeypot, and the figures should be read as the proportion of a result set that the platforms themselves flag or that sits on infrastructure inconsistent with an installed industrial device.
Two figures central to the argument, the protocol-scoped Modbus count and the provider fleet, were checked after drafting. The provider fleet was re-derived from the consolidated dataset and confirmed at 271 UK addresses on a single hosting provider across 72 subnets. The Modbus count was re-run against the platform and returned one additional result, as described in the 427, or 4? section . The port-102 host count in Table 5 was read from the platform at the time of collection and has not been re-run.
Counting basis differs by platform. One reports banner records rather than hosts; all figures here are address counts derived by deduplication. A second reports host and port assets. A third applies its own honeypot exclusion silently by default, so its figures are already filtered whether or not the filter is requested, which we confirmed by running both forms.
What the Next Study Must Add
No persistence analysis was possible. All records fall within one observation window. This article therefore measures breadth and coverage but not time, and cannot distinguish a transient exposure from a permanent architectural condition. Persistence is the single largest gap in this method and the necessary input to any attempt to move from describing exposure to anticipating risk. A repeat collection at monthly intervals against the same query set is the next research phase, and no forward-looking claim should be made from data of this shape until it exists.
Six further limits apply.
- One access-layer vendor could not be enumerated on the primary platform across five separate fingerprints and is represented only by a count from the second.
- Two industrial protocols were not enumerable at the license tiers held, and a third returned no product labels anywhere. Their absence from these figures is a tooling statement, not evidence that the devices are absent.
- Five Schneider product strings on port 502 remain uncollected, and the classified fraction varies enough between strings that the residual Modbus figure is provisional.
- Geolocation below country level was not used. On small autonomous systems without reverse DNS, platforms disagree with each other and with themselves across adjacent addresses.
- Exposure is not compromise. Firmware revision, credential state and downstream process function were not established for any host, and no claim is made that any device is exploitable or controls anything consequential.
- The incident that prompted this work is used as motivation only. No finding here depends on it, and no claim is made about its cause, entry path or the equipment involved.
The consolidated dataset, the exclusion register and the full query set are held with this article and are available on request for verification.