
By Adrian Cheek, Senior Cybercrime Researcher
The standard story about higher education cybersecurity is that it’s target-rich and cyber-poor: a sprawling, underfunded sector where the weakest links are the community colleges and cash-strapped campuses without the budget for a real security program. This study finds the opposite pattern.
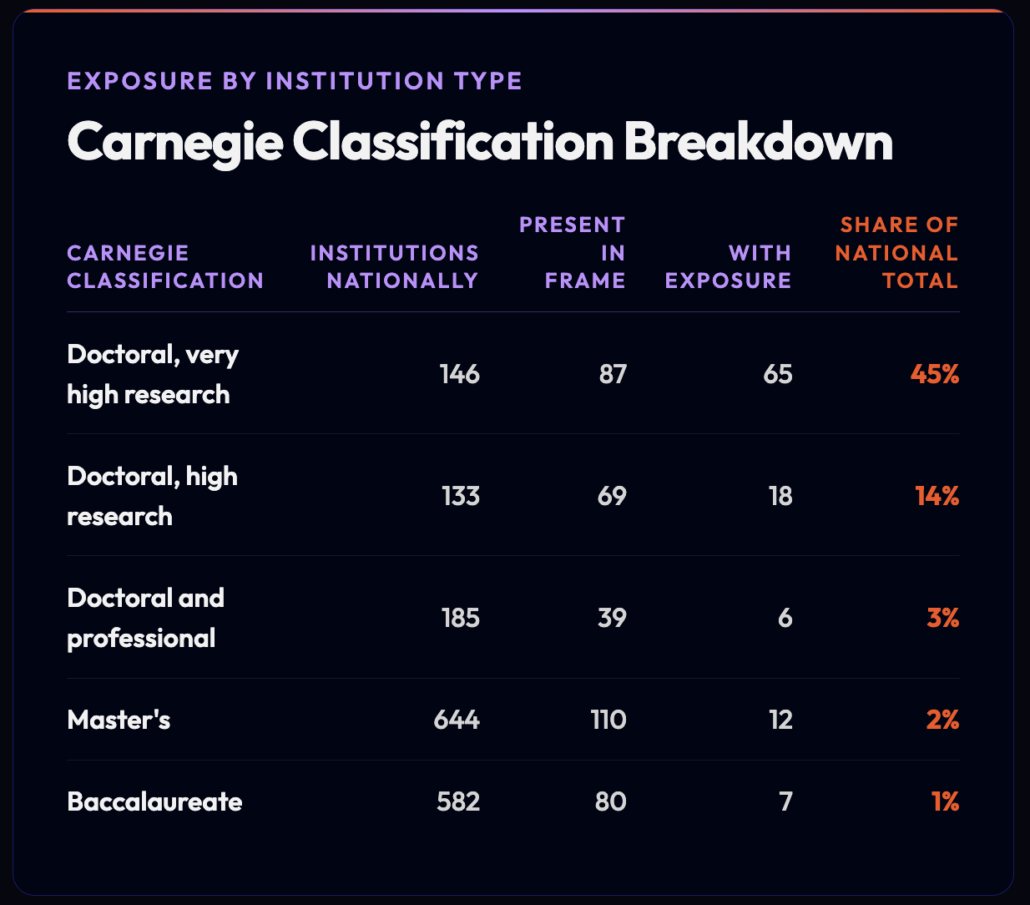
45% of the nation’s most research-intensive universities, doctoral institutions with very high research activity, as classified by Carnegie, expose at least one research computing service to the open internet. That’s 65 of 146 institutions, measured against the national register, not a sample estimate. Meanwhile, the community colleges and government and municipal bodies sharing the same research and education networks show zero exposure across 158 organizations. Not lower exposure. None.
The gradient isn’t a security story. It’s a scientific computing story. Exposure declines monotonically as research intensity declines, from 45% at the top Carnegie tier down to 1% at baccalaureate institutions, because the infrastructure in question (data transfer nodes, cluster telemetry, network measurement hosts) only exists where an institution runs large-scale research computing in the first place. You can’t expose a Globus data transfer node you don’t operate. The best-resourced institutions in the sector carry this attack surface precisely because they’re the best-resourced institutions in the sector.
Key Takeways About Exposed Computing Infrastructure for American Research Universities
- 45% of the nation’s most research-intensive universities expose at least one research computing service. This is 65 of the 146 institutions classified as doctoral with very high research activity, measured against the national register. It is not a sample estimate.
- Exposure follows research activity, not resource scarcity. The rate declines monotonically from 45% at the highest research tier to 1% at baccalaureate institutions. Institutions on the same networks without scientific computing show almost no exposure, despite having weaker security programs by most published measures.
- The single largest finding class is unauthenticated cluster telemetry. 711 Prometheus node exporter endpoints were observed, 504 in North America. 710 of 711 disclosed an operating system identification including the exact kernel build. This is per-node patch-level inventory of research clusters, retrievable without authentication.
- Historically under-resourced institutions like HBCUs and tribal colleges did not show up disproportionately in a scan like this. Not one HBCU in the dataset (of 20) had an exposed system, and no tribal college appeared in the dataset at all. This is because the resource gap here shows up as a lack of large-scale research computing, not a lack of security around it.
Flare Academy Discord Community
Get the Latest Cybercrime Research
The Flare Academy Discord is where security practitioners and threat researchers break down discussions like this one. Join the conversation and connect with the community working these problems daily.
Overview of the Institution Types
Exposure declines monotonically with research intensity.
Public institutions in the frame present exposure at 34%, private non-profit institutions at 16%. No private for-profit institution was present in the frame.
The same gradient is visible in the organizational segmentation of the wider routing cone, which includes members outside the postsecondary sector.
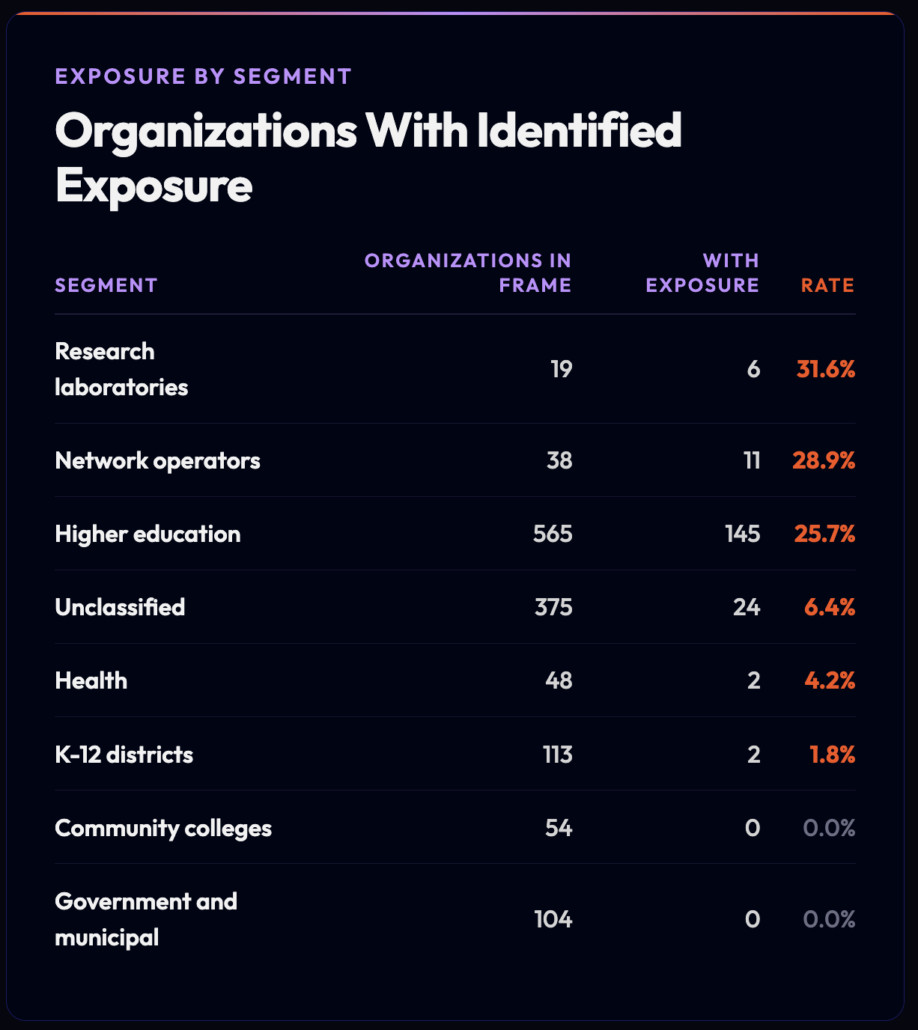
The gradient differs from the common assumption that exposure follows resource scarcity. In this dataset exposure follows research activity. Institutions that operate scientific computing show this surface. Institutions on the same networks without scientific computing show almost none of it, despite having weaker security programs by most published measures.
20 HBCUs were present in the frame. None presented any observation in any service class. No tribal college was present at all. The resource gradient in this sector appears here as an absence of research computing infrastructure. It does not appear as weaker protection of that infrastructure.
Infrastructure hosted outside the frame in commercial cloud address space accounts for 11.8% of observations bearing an institutional identity. That share is zero for cluster telemetry, network measurement, data transfer and job accounting, which are the classes producing the result above.
The single largest finding class is unauthenticated cluster telemetry. 711 Prometheus node exporter endpoints were observed inside the frame, 504 of them in North America, and 710 of 711 disclosed an operating system identification including an exact kernel build.
Scope and Definitions
Research and education network: For the purposes of this study, membership is defined by BGP customer cone. The institutional category plays no part in it. An organization is in the frame if its autonomous system is reachable through customer links from a seed national research and education network.
Observation: A service reachable from the public internet whose banner, certificate, or response body identifies it as one of the service classes under study. An observation records reachability and self reported configuration. It does not record a vulnerability, and no claim of exploitability is made anywhere in this document.
Passive collection: All data derives from third party internet wide scanning already conducted and indexed. No host in the frame was contacted by the authors. No authentication was attempted against any observed service. No metrics endpoint, file listing or API was retrieved.
Service classes under study: Interactive computing portals, data transfer infrastructure, network measurement hosts, institutional repositories, cluster accounting and telemetry, and out of band management interfaces.
Methodology
Frame Construction
The population frame was derived from the CAIDA AS Relationships dataset, serial-2 series, file 20260701, joined to the CAIDA AS Organizations dataset. Both were verified against the published MD5 manifest before use.
Cone membership was computed as the transitive closure over provider to customer edges only. Peer to peer links were excluded from traversal. The distinction governs the result. Following peer links expands the closure into the general commercial internet within two hops and produces a frame with no analytical meaning.
Seeds for the North American frame were AS11537, AS11164 and AS396450 (Internet2), AS293 (ESnet), and AS6509 and AS53904 (CANARIE). Seeds were resolved by organization name lookup against the AS Organizations file. Taking them from a compiled list would have introduced at least two misattributions caught during construction.
The comparison cohort used 35 seeds spanning European, Asia Pacific, Latin American and African national research and education networks.
Two large Asia-Pacific transit networks were evaluated and excluded. Their combined cone of 2,673 autonomous systems would have introduced 1,336 members not otherwise present, of which 1,078 are United States registered. Including them would have re-imported the North American population into the supposedly independent comparison cohort by a second transit path.
The raw North American closure contains 2,699 autonomous systems. Restriction to US and Canadian registration reduces this to 1,517. Removal of identified commercial operators produces the working frame of 1,431.
Depth distribution of the working frame:
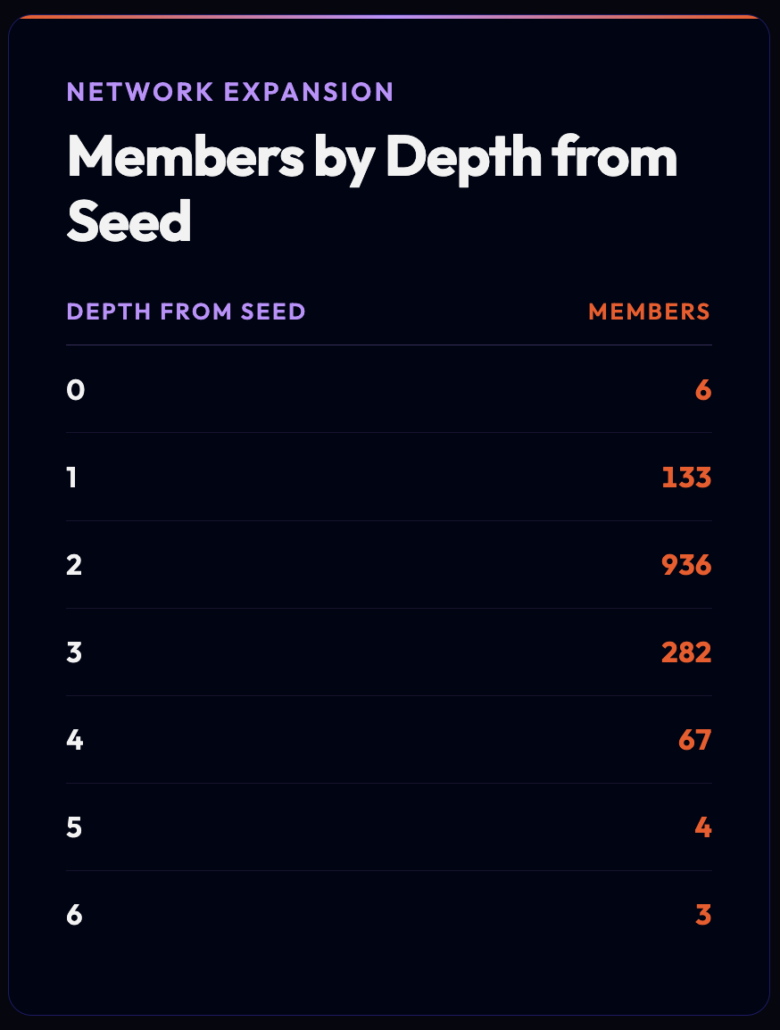
The concentration at depth two, with collapse beyond depth four, indicates that no commercial transit provider entered the closure through a mis-specified seed.
Institutional Join
The routing cone identifies organizations by the name recorded in the AS Organizations file. To express results against a register of institutions, two joins were made to the IPEDS directory file for 2025.
Frame side, cone organization names were normalized and matched against institution names in the directory. 478 of 1,274 named cone organizations resolved to an IPEDS institution. The residual is largely composed of school districts, municipal bodies, national laboratories, and network operators, none of which appear in a postsecondary register. Name matching is imprecise and some genuine institutions will have been missed, so the count of institutions present in the frame is a lower bound.
Observation side, host names and certificate subjects were reduced to registrable domains and matched against the institutional web address recorded in the directory. 656 of 1,388 North American observations resolved to an IPEDS institution, covering 128 institutions.
Because the frame count is a lower bound, any rate computed with the frame as the denominator is an upper bound. Rates computed against the national institutional total avoid this distortion and are the figures reported in the summary.
Carnegie classification codes were verified empirically against institutions of known classification before use.
Collection
Two collection strategies were used, and the difference between them constrains how the results may be compared.
For service classes with a global population small enough to retrieve in full, the unscoped fingerprint was retrieved and filtered against the frame afterwards. This yields complete recall within the limits of the underlying index.
For service classes with a global population too large to retrieve, collection was scoped by organization name before retrieval. Prometheus node exporter, for example, returns 309,584 records globally, of which the five largest organizations are commercial hosting and transit operators accounting for approximately 61,000 records. Organization name scoping using 13 terms derived from the frame’s own organization names covers 904 of 1,316 organizations, or 69%.
Figures for organization scoped classes are lower bounds. They are not directly comparable to figures for globally retrieved classes.
Classification
Service identification was performed on the retrieved banner, certificate subject, and response body. Classification was applied independently of which query produced the record, so that a record retrieved under one fingerprint and identifying as a different service is counted correctly.
Four collection attempts produced no valid observations and were discarded in full. Port-scoped queries for the Slurm daemon ports, the Slurm REST interface, GridFTP and iRODS returned 1,871 records, of which approximately half carried empty banners and none validated against a protocol signature. Non-empty responses on these ports resolved to unrelated services, including a cellular router HTTP daemon on the GridFTP port and a Python application server on the iRODS port. No claim is made about these four service classes.
Two fingerprints required revision during collection. A title-based query for the Dell remote access controller returned two records globally. A certificate subject query for the same product returned 492. Inspection confirms the cause: 360 of 492 present no HTML title and a further 110 return a bad request page, so the title is unavailable to the indexer while the self signed certificate is always present. The Open OnDemand title fingerprint fails in the same manner, returning 22 records globally against a known deployment base far larger than that. Open OnDemand is excluded from the results of this study on that basis. The two failures share a cause worth highlighting directly: web applications that render their interface in JavaScript, or that redirect to an external identity provider before serving content, present no indexable title to a scanning service. Any population study relying on title fingerprints will undercount this class of software, and the size of that undercount is not knowable from the index alone.
De-duplication was applied on the tuple of address, port, and service class. Address alone is unsuitable because 840 addresses in the collected set present more than one service.
Findings of US Research Institution Exposures
Composition of the Frame
The North American research and education routing cone is not composed solely of universities. Segmentation of the 1,316 member organizations by name:
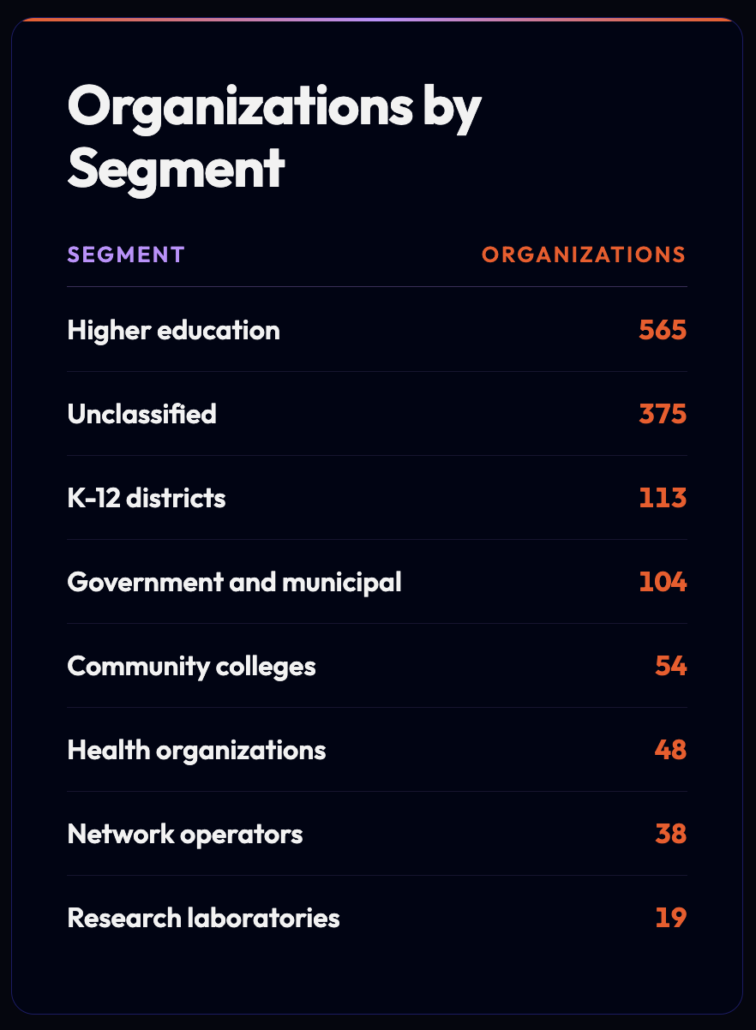
Regional research and education networks provide transit to school districts, county governments, public libraries, and hospitals alongside their university membership. Any study that treats this cone as equivalent to higher education will misstate its own denominator.
Distribution by Segment
The rate column in the executive summary table measures the proportion of organizations within each segment with at least one observation:
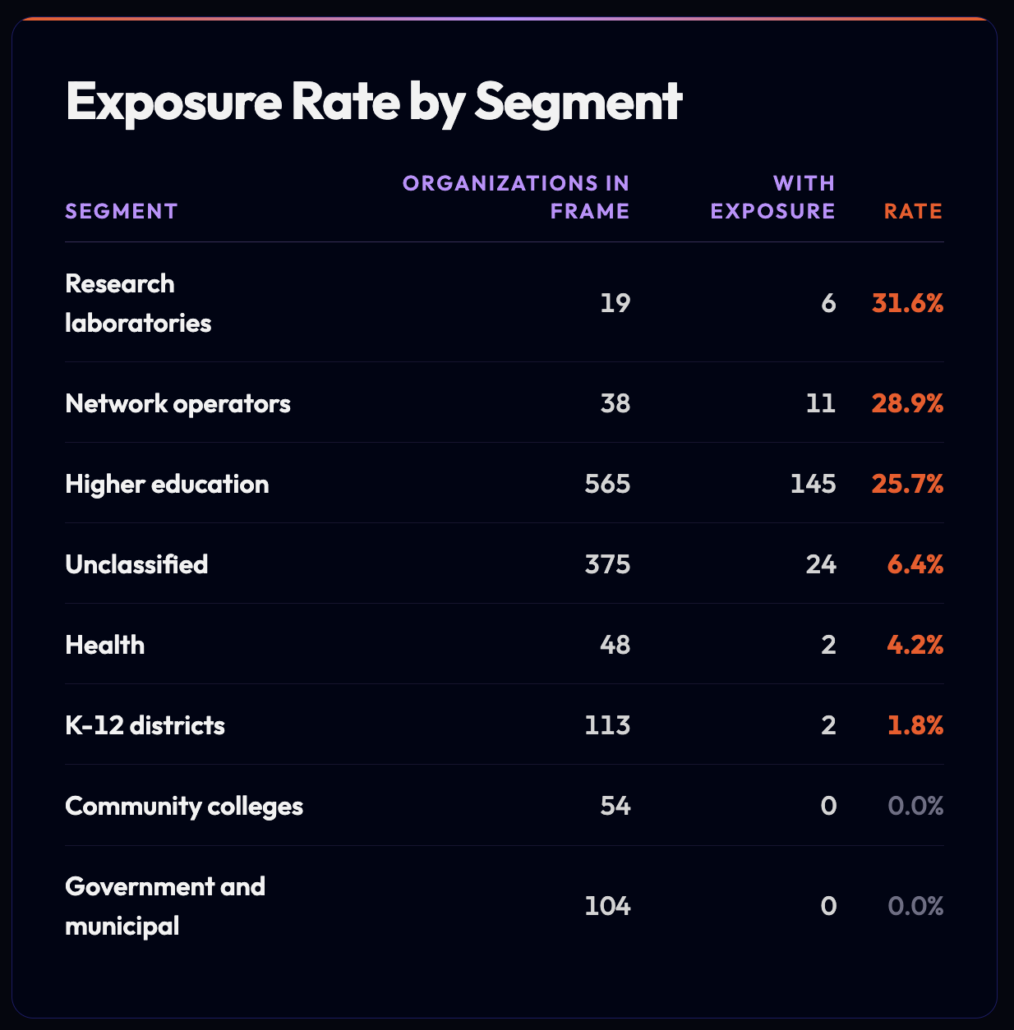
The three segments associated with scientific computing show rates between 25.7% and 31.6%. The four segments without scientific computing show rates between 0% and 6.4%.
Community colleges and government bodies produced no observations at all across 158 organizations.
This distribution supports a specific reading. The exposure measured here is an artefact of operating research computing infrastructure. It follows the scientific mission. An institution acquires this surface by running a cluster, a data transfer node or a measurement host, and the institutions that run the most of that infrastructure are the best resourced in the frame.
Distribution by Research Intensity
Joining observations to the institutional register produces a monotonic gradient across the Carnegie classification. Measured against the national total for each classification:
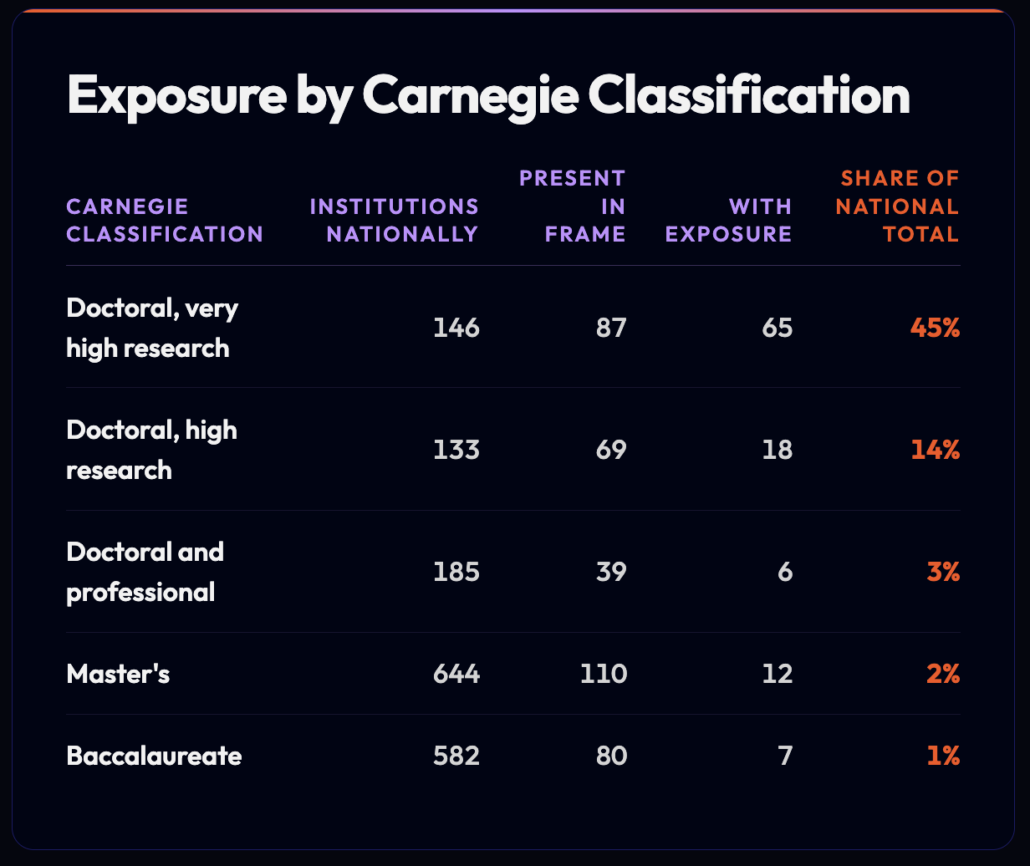
Measured against institutions present in the frame, the same ordering holds at 75%, 26%, 15%, 11% and 9%. The frame denominator is a lower bound and these figures should be read as upper bounds.
The gradient is consistent with the segment distribution reported above and with the concentration reported below. Three independent cuts of the data produce the same ordering.
Institutions without the Surface
20 HBCUs were present in the frame and none presented an observation. No tribal college was present in the frame.
This result concerns infrastructure and says nothing about the security posture of those institutions. The service classes measured in this study exist where scientific computing is operated at scale, and the institutions that operate it at scale are the best resourced in the sector. An institution acquires this attack surface by acquiring a research computing program.
The observed distribution runs against the standard sector narrative in a specific way. Where the literature describes education as uniformly “target rich and cyber poor,” these data separate the sector into a research-intensive tier with substantial externally visible infrastructure and a remainder with almost none. Guidance addressed to the sector as a whole will misfit one of those two groups.
Shared National Infrastructure
A substantial share of observations belongs to no single institution.
The largest unattributed domains in the North American set are a network emulation testbed with 79 observations, a national cloud computing platform with 48, the Globus service infrastructure with 32, and a regional research network with 31. These are federally funded shared cyberinfrastructure facilities operated at host universities on behalf of a national user community.
Exposure of shared facilities differs from institutional exposure in consequence and in remedy. The operator is a funded project with its own staff. The user community is national. Disclosure runs to the funding body and the facility operator, with the host institution outside the loop.
Concentration
51 North American organizations present three or more distinct service classes. The most heavily represented include:
- Merit Network: eight classes
- Indiana University and the University of California at Berkeley: seven each
- University of Washington, the University of California at Los Angeles, the University of Chicago, Purdue University, the Massachusetts Institute of Technology (MIT), and Columbia University: six each
Exposure is unevenly spread across research-intensive institutions. It clusters at those with the largest research computing programs.
Observations by Service Class
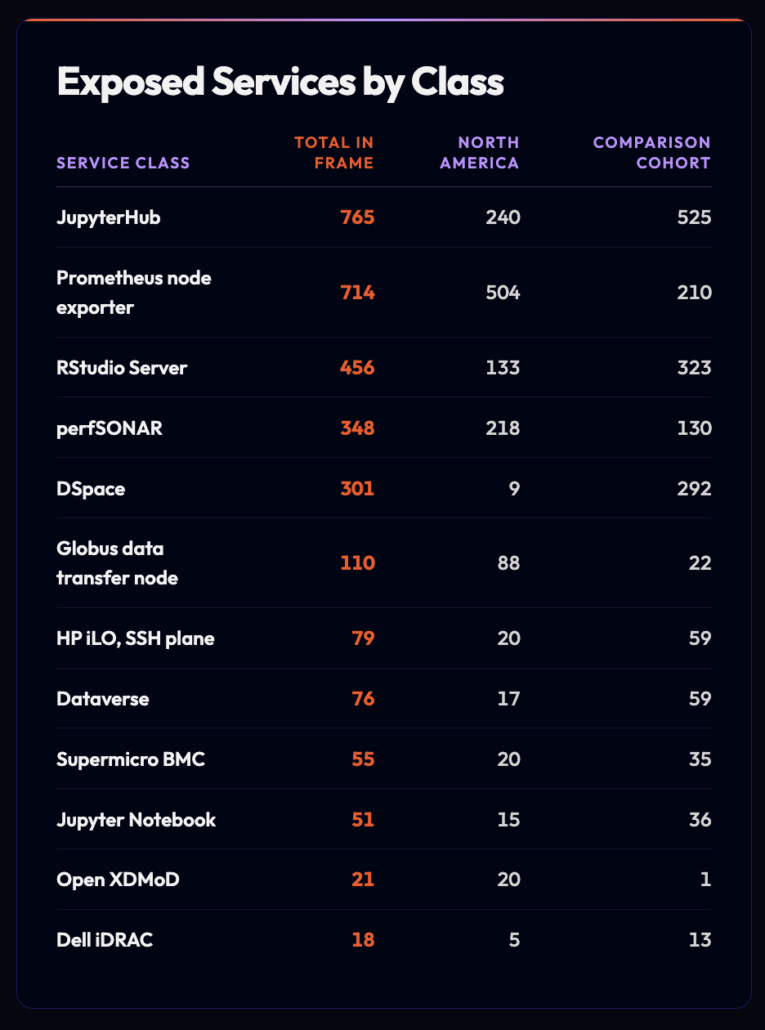
Two distributions merit comment.
Globus data transfer nodes show the highest frame hit rate of any class studied. 88 of 137 globally retrieved records fall inside the North American cone. This fingerprint has almost no population outside research and education, which makes it the most reliable single indicator of research computing infrastructure available through passive collection.
Institutional repository software inverts the pattern. DSpace returns nine observations in North America against 292 in the comparison cohort. Open access repository deployment is a European and Latin American phenomenon in this dataset.
Infrastructure Hosted Outside the Frame
Observations bearing an institutional identity in a host name or certificate subject were classified by whether the announcing autonomous system belongs to the frame or to a commercial cloud provider. Of 1,051 observations bear such an identity: 682 fall inside the frame, 124 in commercial cloud address space, and 245 elsewhere.
The overall omission is 11.8%. Its distribution is uneven in a way that matters for the interpretation of this study.
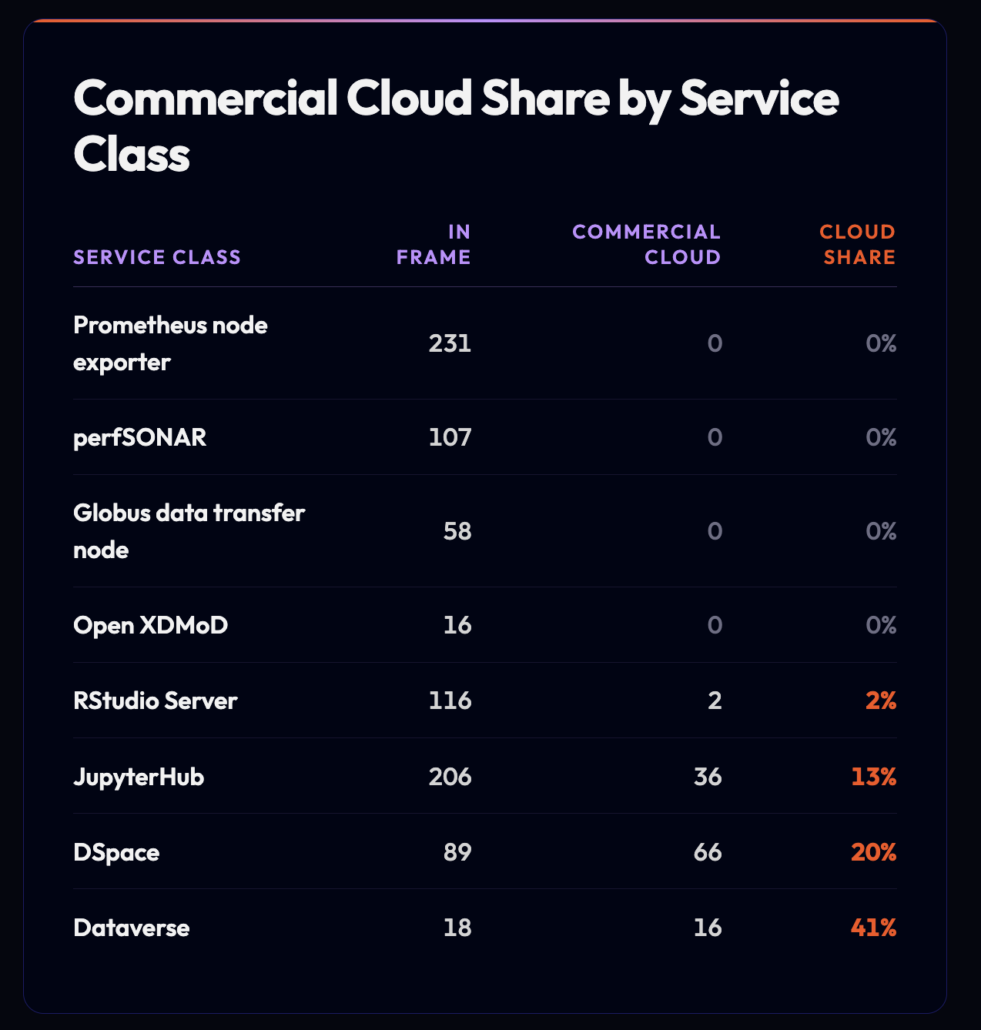
The classes that produce the research intensity result show no measurable migration to commercial hosting. Cluster telemetry, network measurement, data transfer and job accounting are bound to physical compute, campus storage and measured network paths, and none of them functions when separated from that hardware. The omission is concentrated in repository platforms, which contribute nothing to the distribution result and which the service class figures already identify as predominantly non-US deployments.
This bears on a possible alternative explanation. If research intensive institutions operated on premises while less research intensive institutions purchased managed cloud services, the gradient reported above would measure hosting procurement instead of research activity. The service classes producing the gradient are not available as managed cloud services in any form that would appear outside the frame, so the alternative explanation does not hold.
Where the classification is by cloud provider, Amazon accounts for 49 observations, Google 24, Microsoft 11 and the remainder is spread across smaller hosting operators.
Cluster Telemetry
The Prometheus node exporter population is the largest single finding class and differs from the others in character.
711 endpoints were observed within the frame across 62 organizations. Two institutions account for 339 of them. 710 of 711 disclosed an operating system identification including the exact kernel build, with 126 hosts reporting one AlmaLinux 9.8 kernel revision and a further 84 reporting the next revision of the same series.
The node exporter serves an unauthenticated metrics endpoint by design. That design is safe under the deployment assumption the software documents, which is that the endpoint is reachable only from an internal scrape network. Every observation in this class represents a departure from the documented deployment model. None represents a decision to publish.
The disclosed data constitutes per node patch level inventory of research clusters, retrievable without authentication and without any interaction beyond that already performed by commercial scanning services.
Out-of-Band Management
48 North American organizations present at least one out-of-band management interface across the node exporter, Supermicro, iLO and iDRAC classes.
Certificate data from the Dell population discloses a further attribute. 16 of 18 observed certificates encode the chassis service tag in the certificate common name. A service tag resolves to model, configuration and warranty status through the vendor’s public support lookup, so the certificate discloses hardware inventory without any interaction with the host.
None of the 18 observed certificates had expired. This is inconsistent with a population of forgotten equipment and suggests actively maintained devices that became reachable through a network configuration change.
Limitations
The most significant constraint on this study is stated first.
The frame is topological. Membership is defined by routing relationship. Institutions without their own autonomous system, which includes most small colleges, occupy address space belonging to a regional provider and cannot appear as frame members. This study measures the research and education routing cone. It does not measure US higher education, and a join to institutional registration data would be required before any such claim.
Cloud hosted infrastructure is out of frame by construction. An institutional portal hosted in a commercial cloud sits in that provider’s autonomous system and cannot appear as a frame member. The magnitude of the omission was measured and is reported in the findings. It is 11.8% of observations carrying an institutional identity, and it is close to zero for the service classes on which the central result depends.
Recall differs by service class. Globally retrieved classes have complete recall within the index. Organization scoped classes have bounded recall estimated at 69% of frame organizations. Rates are lower bounds and cross class comparison should be avoided.
Institutional attribution is incomplete. 656 of 1,388 North American observations resolved to an IPEDS institution. The residual comprises Canadian institutions, which are outside the IPEDS universe by construction, shared national facilities, which are not postsecondary institutions, and institutions whose operational domain differs from the web address recorded in the directory. The last category is a correctable defect and at least four institutions are known to be affected.
Frame membership counts are lower bounds. Cone organizations were matched to the institutional register by normalised name. 796 of 1,274 did not resolve. Rates expressed against frame membership are upper bounds. Rates expressed against national institutional totals avoid this distortion.
IPEDS covers US institutions only. Canadian members of the frame, entering through the CANARIE seed, have no institutional classification available and are excluded from all rate calculations by research intensity.
Segmentation is name derived. Organization segment was assigned by pattern matching against organization names in the AS Organizations file. 375 organizations resolved to “unclassified” and are reported as such.
Commercial members remain. An identified commercial operator filter removed 98 autonomous systems. Inspection of the residual set shows further commercial organizations present, including several with names that do not match a general pattern. The frame is not fully cleaned of commercial members.
Observation is windowed. Banner timestamps span June 28 to July 28, 2026. This is a 31-day window. It is not a snapshot. Statements about persistence are not supported by a single collection pass.
Index dependency. All observations derive from one commercial scanning index. Coverage gaps in that index propagate directly into these figures. A second index was not used.
Recommendations for Relevant Stakeholders
For institutions operating research computing infrastructure:
- Audit the exposure of telemetry endpoints separately from the exposure of user facing portals. The portal population in this study is largely authenticated. The telemetry population is unauthenticated by design and appears to have been exposed without intent.
- Confirm that out-of-band management interfaces are reachable only from a management network. The presence of current certificates in the observed population indicates active maintenance, which points to network configuration as the origin of the exposure.
- Treat data transfer node exposure as expected and verify that the authorization model is functioning, since these hosts are placed outside the perimeter deliberately.
For operators of shared national cyberinfrastructure:
- Facility-level exposure is not visible to the host institution’s security program and is not addressed by campus guidance. Facilities should be audited by the operating project against their own deployment documentation.
For regional and national research and education network operators:
- The routing cone includes school districts, municipal bodies, and health organizations. Guidance developed for university members does not necessarily reach or suit these members.
For sector bodies and funders:
- Guidance addressed to the education sector as a single population will misfit either the research intensive tier or the remainder. The two groups present substantially different externally visible infrastructure, and research activity accounts for the difference.
Adding Nuance to the “Higher Education” Sector
The standard narrative about higher education cybersecurity treats the sector as a single population: under-resourced, over-exposed, and uniformly vulnerable. This data tells a different story. Exposure in this sector is not a symptom of weak security programs, and instead is a byproduct of operating research computing infrastructure, and it concentrates precisely where resources are greatest, not where they are scarcest.
The 45% figure at the top of the Carnegie classification is not a failure rate, but actually the measurable footprint of institutions doing what they were built to do: running clusters, moving petabytes between collaborators, and measuring the networks that carry them. The telemetry finding is the exception that proves the concern. 711 unauthenticated Prometheus endpoints did not end up on the public internet because someone decided to publish them. They ended up there because the deployment model assumes a network boundary that, in a Science DMZ architecture, does not exist in the way the software expects. That is a fixable mismatch between two legitimate design decisions, not a systemic security failure. For sector bodies, funders, and network operators, the practical implication is that guidance written for “higher education” without distinguishing between a research-intensive university and a community college doesn’t fully capture the necessary nuance. One group needs help governing deliberate exposure, while the other has almost none to govern. Treating them differently is the right step in guaranteeing the appropriate action for them.
Flare Academy Discord Community
Get the Latest Cybercrime Research
The Flare Academy Discord is where security practitioners and threat researchers break down discussions like this one. Join the conversation and connect with the community working on these problems.
Data Citation
The CAIDA AS Relationships Dataset, 20260701
https://www.caida.org/catalog/datasets/as-relationships
The CAIDA AS Organizations Dataset, 20260701
https://www.caida.org/catalog/datasets/as-organizations
doi:10.21986/CAIDA.DATA.AS-TO-ORG-MAPPING
Integrated Postsecondary Education Data System, Directory Information (HD) file, 2025
National Center for Education Statistics, United States Department of Education
https://nces.ed.gov/ipeds/datacenter/DataFiles.aspx
Appendix: Service Classes and Terms
Autonomous system. A network under single administrative control, identified by a number and visible in global routing.
Customer cone. The set of networks reachable from a given network by following provider to customer relationships. Used here to define membership of the research and education population.
Carnegie Classification. The standard categorisation of United States higher education institutions by degree activity and research output, recorded in the IPEDS directory.
Science DMZ. A network segment placed outside the institutional firewall to allow high throughput scientific data transfer without the performance penalty of stateful inspection.
Open OnDemand. A web portal giving browser access to high performance computing clusters, including shells, file transfer and interactive applications.
JupyterHub and Jupyter Notebook. A multi-user server and a single-user interactive computing environment for code, data and visualisation. JupyterHub authenticates users and provisions individual notebook servers.
RStudio Server. A browser accessible development environment for the R statistical language, commonly deployed on shared analysis hosts.
Globus. A managed file transfer service for research data. A Globus data transfer node is a host placed outside the perimeter to move large datasets between institutions.
perfSONAR. A network measurement toolkit deployed at institutional and network boundaries to diagnose throughput problems on research paths. Instances are reachable by design.
Slurm. A workload manager that schedules jobs across compute nodes on a cluster.
Open XDMoD. A tool that reports utilisation, job accounting and performance metrics for high performance computing resources.
Prometheus node exporter. An agent that publishes host level metrics, including operating system, kernel version, hardware and resource utilisation, over an unauthenticated HTTP endpoint. The software documents an expectation that the endpoint is reachable only from an internal collection network.
DSpace and Dataverse. Repository platforms used to publish institutional research outputs and research datasets respectively.
Out of band management. A dedicated processor on a server that provides power control, console access and hardware monitoring independently of the operating system. Vendor implementations include the Supermicro baseboard management controller, the Dell integrated remote access controller and the Hewlett Packard integrated lights-out controller.