
By Estelle Ruellan, Threat Intelligence Researcher
How stolen fintech credentials are growing, where they come from, and how far they reach into the systems banks run on
Financial technology (fintech) is now part of everyday life. People pay friends through apps, invest from their phones, and borrow at checkout. That convenience has a side effect: every one of these accounts is also a login that can be stolen.
This report looks at stealer logs from infected machines in North America that contained financial services credentials. Across Flare’s entire collection, 1,773,227 such devices have been identified, and nearly 40% of them appeared in just the last 24 months. Focusing on that period, September 2024 to August 2026, this report shows how fast the problem is growing, which financial services are most exposed, how exposure differs between Canada, Mexico, and the US, and where stolen credentials reach beyond individual customers into the systems banks depend on.
Key Findings about North American Financial Services Stealer Logs
- Financial services logs in North America are up 56.3% year-over-year. About 422,747 logs were shared on underground forums between September 2025 and August 2026, up from 270,444 the year before. That’s roughly 35,229 a month, up from 22,537.
- Monthly volume has settled at nearly double its old level. After eight straight months of growth, peaking at 50,541 logs in March 2026, volume has held at 37,000-40,000 a month, about double the previous year’s baseline.
- Two out of three North American financial services logs come from the US. The US accounts for 65.3% of logs, Mexico 22.7%, and Canada 12.1%.
- Challenger banks, consumer lending, and banking infrastructure are almost entirely a US exposure. Over 98% of logs with these credentials come from US machines.
- Over 2,000 infected machines held operator access to systems banks depend on, including card-issuing consoles, core banking vendors, and payment rails. A single one of these credentials could reach every institution running on that system.
- 2,644 logs point to financial services employees, not customers. These machines held both a financial services platform login and a corporate email from the same company, a potential foothold into the company itself.
- Employee exposure holds at about four in 1,000 logs across North America.
Identity-First CTI for Financial Services
1,773,227 infected devices across North America. Want to check if your customers and employees among them?
Financial services stealer logs in North America are up 56.3% year-over-year, and over 2,000 infected machines held operator access to systems banks depend on. Flare monitors underground forums and stealer log markets so you can find exposed credentials before attackers use them.
North American Financial Services Logs are up 56% Year-over-Year
Across Flare’s entire collection, 1,773,227 North America-located infected devices have yielded financial services credentials. Roughly 40% (693,191) of them surfaced in underground forums in the last 24 months alone.
That growth is accelerating. Between September 2024 and August 2025, 270,444 North American financial services logs were shared on underground forums. Over the following year, September 2025 to August 2026, that number went up by 56.3%, reaching 422,747 logs.
Switching to monthly figures puts things into perspective. In the first year, 22,537 infected machines with financial services credentials were shared each month. In the second year, that average rose to 35,229 per month, roughly 12,800 more every month.
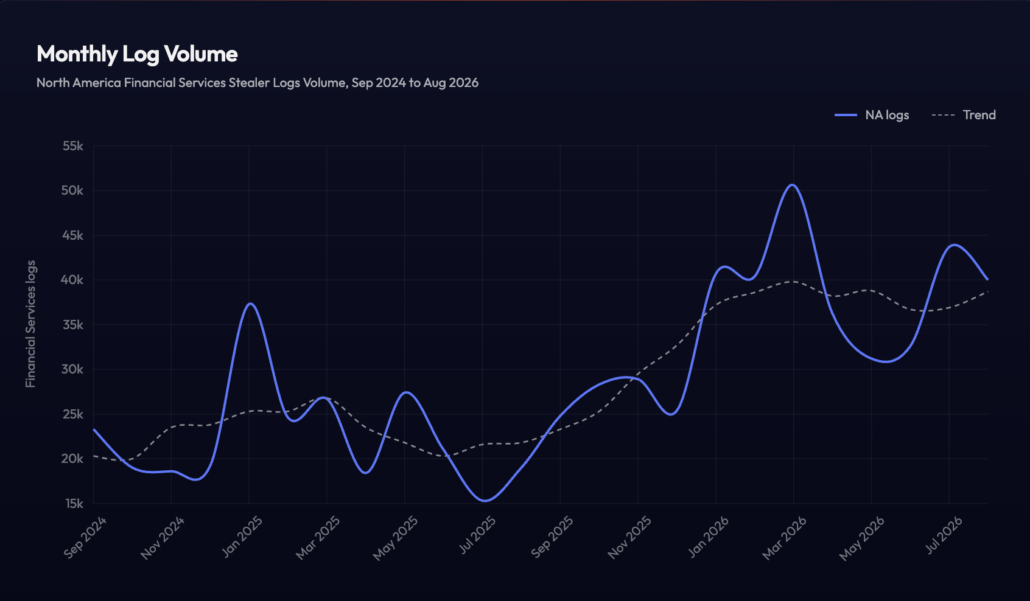
The figure above shows the monthly volume of North American financial services stealer logs from September 2024 to August 2026. The dashed line is a three-month rolling average, which smooths out short-term spikes to show the overall direction. From September 2024 through mid-2025, volume trend held a flat baseline of roughly 18,000-27,000 logs a month, interrupted by a single spike to 37,299 in January 2025.
It bottomed at 15,347 in July 2025, then climbed for eight months in a row to peak at 50,541 in March 2026.
Since that peak, volume has swung between roughly 31,000 and 44,000 logs a month, with the trend line holding between 37,000 and 40,000, about double the earlier baseline. The renewed climb through July 2026 suggests this is a higher plateau rather than a return to earlier levels, though the coming months will show whether it stabilises here or starts climbing again.
Two Out of Three North American Financial Services Logs come from the US
The Sankey graph below shows how North American logs split between Canada, Mexico, and the US. Over the past 24 months, 65.3% of North American stealer logs containing financial services access credentials were geolocated in the US, 22.7% in Mexico, and 12.1% in Canada.
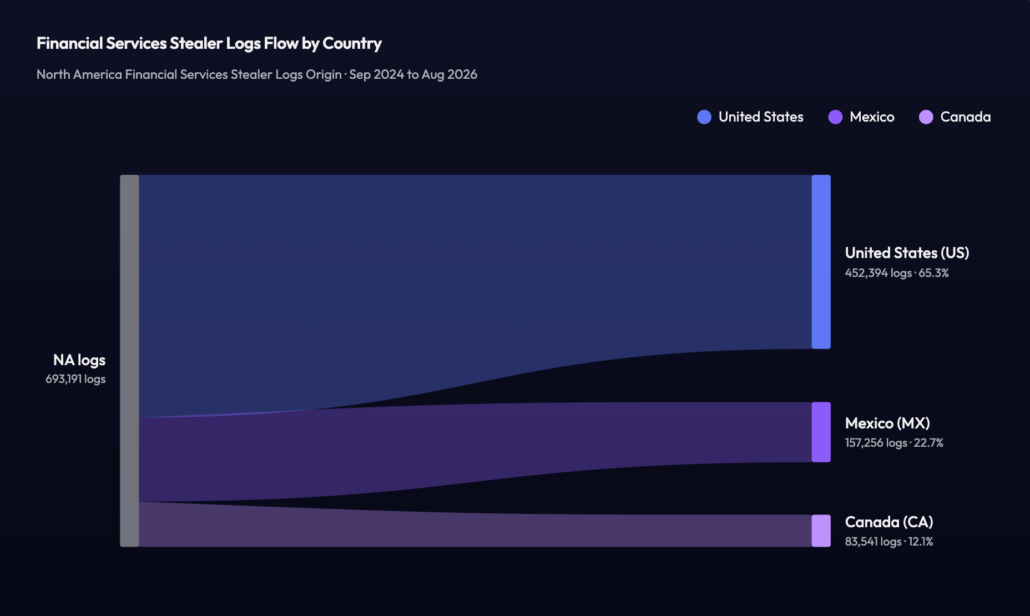
In other words, the US accounts for roughly two out of every three North American financial services logs.
Anatomy of a North American Financial Services Log
We have organized the different categories of financial services into:
- Fintech & Specialist Platforms: For specific financial functions including peer-to-peer payments and international money transfers.
- Traditional & Established Banks: Most people use these for everyday financial tasks such as payroll, banking, saving, and mortgages.
- Investment, Brokerage, & Wealth: For longer-term saving rather than spending such as retirement accounts.
- Digital Challenger Banks: App-forward banks that compete with Traditional & Established Banks.
- Consumer Credit & Lending: These provide access to credit.
- B2B Banking Infrastructure: These offer core banking engines, payment rails, and ledger systems that banks use, including some of the largest financial institutions in the world.
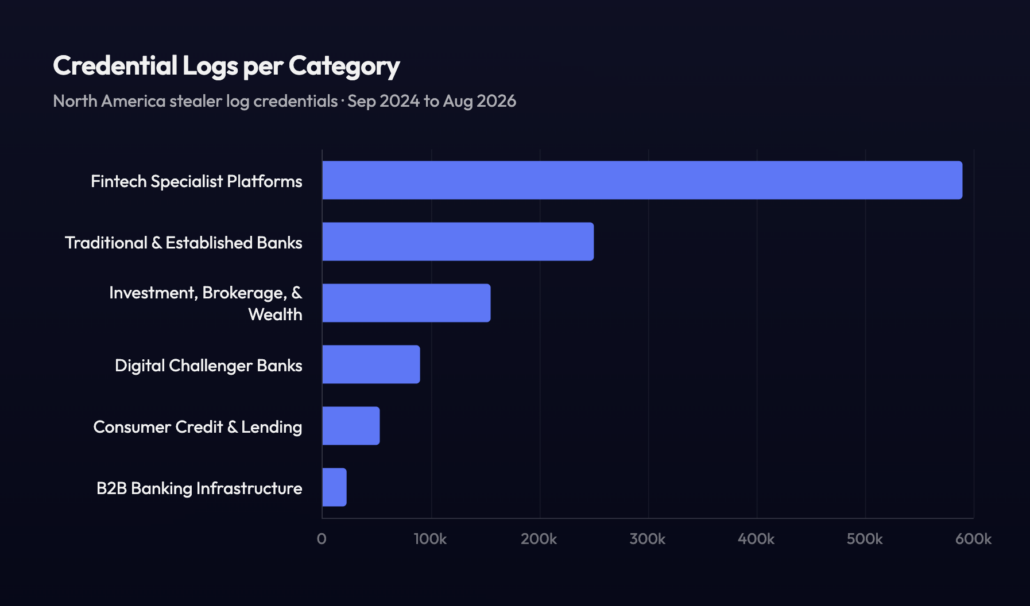
A breakdown by services category reveals that Fintech & Specialist Platform credentials dominate our credential dataset by a wide margin, followed by Traditional & Established Banks and Investment, Brokerage, & Wealth at a different scale. The horizontal bar chart below illustrates the financial services category breakdown.
Another more interesting way to read this breakdown is as odds. If you picked a North American fintech log at random, what would you expect to find inside?
The answer is, in most logs, at least one credential to a Fintech & Specialist Platform, as 85.2% of logs contain one. The second most likely is a Traditional & Established Bank login. Over one in three logs hold access to a Traditional & Established Bank, followed by an Investment, Brokerage, & Wealth account in more than one in five. Access to banking infrastructure is rare, found in about one log in 30. Because a single log often holds several types of access, the odds add up to well over 100%.
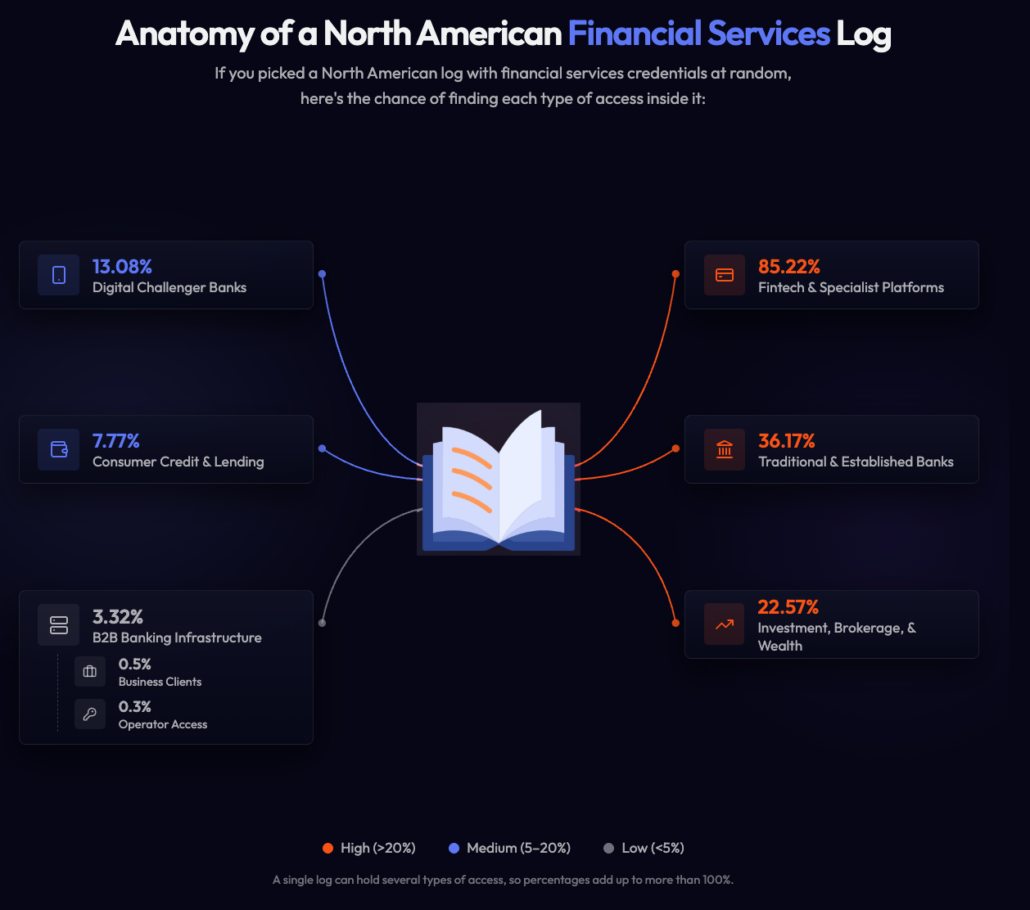
Fintech & Specialist Platforms: 590,823 Logs (85.2%)
These platforms are not banks. They don’t hold deposits or offer current accounts. Each one is built around a specific financial function, such as:
- international money transfers
- payment processing
- peer-to-peer payments
- direct debit collection
- open banking connectivity
A compromised account on these platforms could enable unauthorized international transfers, manipulation of payment collection mandates, instant transfers to accounts controlled by the attacker, or access to the financial plumbing that connects bank accounts to third-party services.
With over 590,000 logs, Fintech & Specialist Platforms credentials are in over eight out of 10 infected devices in our dataset.
Traditional & Established Banks: 250,697 Logs (36.2%)
Over one in three North American financial services logs had a traditional bank access credential. Most people use these banking services every day for tasks such as payroll, banking, saving, and mortgages.
A compromised credential here is a direct line to current accounts, savings, transaction histories, and personal financial data. Unlike Fintech & Specialist Platforms where exposure is typically limited to a single function, a Traditional & Established Bank account is the financial hub: payroll deposits, mortgage payments, direct debits, and card transactions all flow through it, making each compromised credential a gateway to a complete financial profile.
Investment, Brokerage, & Wealth: 156,437 Logs (22.6%)
These hold the money people are saving rather than spending: retirement accounts, brokerage portfolios, college funds, and long-term investments. Over one in five logs in our dataset carried credentials to one of these platforms.
A compromised brokerage account gives an attacker the account holder’s full portfolio, transaction history, and tax documents, which typically include a Social Security number, date of birth, and linked bank details. That is enough to open credit elsewhere or impersonate the victim at another institution.
Digital Challenger Banks: 90,671 Logs (13.1%)
App-first banks are built to compete with the traditional institutions. The risk from a compromised challenger bank account is identical to a traditional bank: full access to the account, balances, transaction history, and the ability to initiate payments or transfers. With over 90,000 logs, challenger banks are present in 13.1% of North American financial services logs.
Consumer Credit & Lending: 53,846 Logs (7.8%)
Almost one in 12 logs in our dataset held credentials to a consumer credit lending service.
These companies give people access to credit rather than holding their everyday money. The risk here is borrowed money, not stolen savings. A compromised account comes with an approved credit line an attacker can spend immediately: BNPL purchases, store-card purchases, or cash advances, all charged to the victim. On some platforms, an attacker can also request a replacement card to a new address or add an authorized user, turning a single login into ongoing fraud.
These accounts also hold the data lenders need to approve credit: income, employer, date of birth, Social Security number, and linked bank accounts. That is enough to apply for new loans or cards in the victim’s name elsewhere. Because the losses land as debt, victims often find out only when a bill arrives or their credit score drops.
B2B Banking Infrastructure: 23,042 (3.3%)
These build the core banking engines, payment rails, and ledger systems that financial services run on. Their clients include some of the largest financial institutions in the world.
This is a small share of our dataset, but in principle the most consequential. These platforms process transactions, manage accounts, calculate interest, and enforce compliance rules for millions of customers across many institutions at once. Depending on privilege, an attacker inside one could view or change how accounts are structured across client banks, interfere with transaction processing, or disrupt ledger operations at scale.
The reality in this dataset is more nuanced, and not every login in this category belongs to someone inside the banking system. We sorted the logs into three groups:
- Consumers: people using a service these vendors run on behalf of their bank, such as benefit cardholders, credit union members, and account applicants.
- Business clients: companies using these platforms for their own operations, such as investment firms, business banking customers, and merchants.
- Operator access: anyone with access to a system banks rely on to deliver their services, including core banking, card issuing, payment rails, and the vendor portals bank staff use.
Most Logins Belong to Consumers
84% of the logs from one company comes from a single login service used by benefit cardholders. Another company’s logs come mostly from credit union members using hosted home banking, and a third company’s logs come mostly from people applying for accounts. These are ordinary users, not people working on bank systems.
About 3,300 Business Clients
Most access in this category comes from staff at investment and fund-administration firms using software in this category. The rest are business customers using one company’s treasury platform and merchants on a compliance portal. These accounts can expose investor data and payment workflows, and in the case of treasury platforms, used to send ACH and wire payments, making them targets for wire fraud.
Just Over 2,000 Operator Access
After filtering out consumer and business clients, 2,008 (~0.3%) infected machines held operator access to systems that banks depend on. Despite representing just a fraction of our dataset, this is arguably the most consequential category in the entire report.
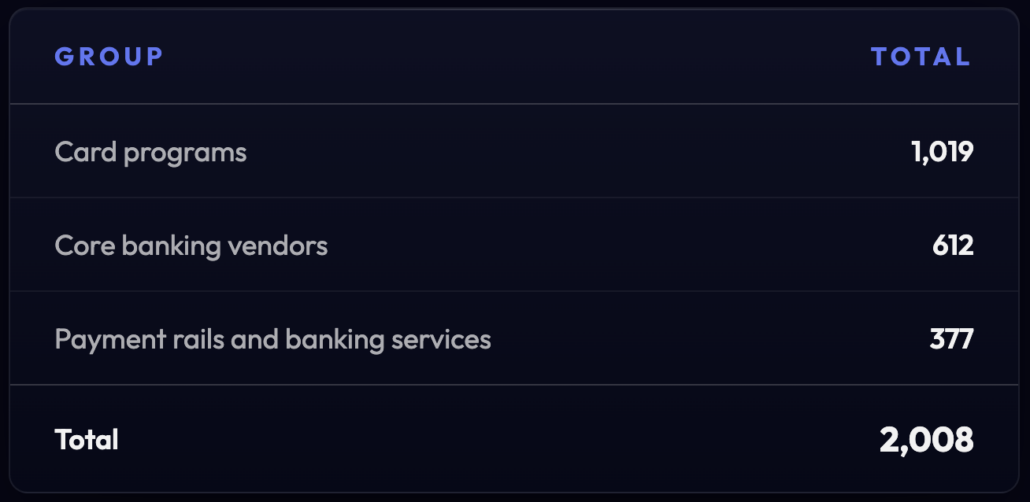
One platform stands out. Its dashboard is the control panel financial services use to run their card programs: issuing cards in bulk, managing cardholders, handling disputes, and granting access. Not every session is equal, though. Admins choose which programs each user can reach and set per-permission access levels, from no access to view and edit, and cardholders’ personal data requires separate approval from this company. A stolen “support-agent” session is limited to what that role allows. A stolen admin session, which can add users, assign roles, and impersonate others, reaches an entire card program, not a single account.
Two vendors that have no consumer-facing accounts produced a handful of logs, meaning each belongs to someone working directly on core banking software.
Note: Counts largely reflect workforce size and customer base, not the relative security posture of any institution.
Why it Matters
The blast radius of a single compromised banking infrastructure credential is potentially every institution running on that infrastructure. About 2,000 infected machines, whether corporate-issued or personal devices used for work, held access to systems that banks depend on. That turns routine infostealer activity into a supply-chain risk for the banking sector.
Note: The counts overlap, so one infected machine can hold credentials for several vendors, which is itself a sign the victim worked in or around the sector. Group totals are therefore upper bounds.
Challenger Banks, Credit & Lending, and Banking Infrastructure: a Near-Exclusive US Exposure
The figure below shows how each financial service type’s North-America-wide logs split between the three countries. The dashed line is the US share of all North American logs (65.3%), the baseline each category can be compared against.
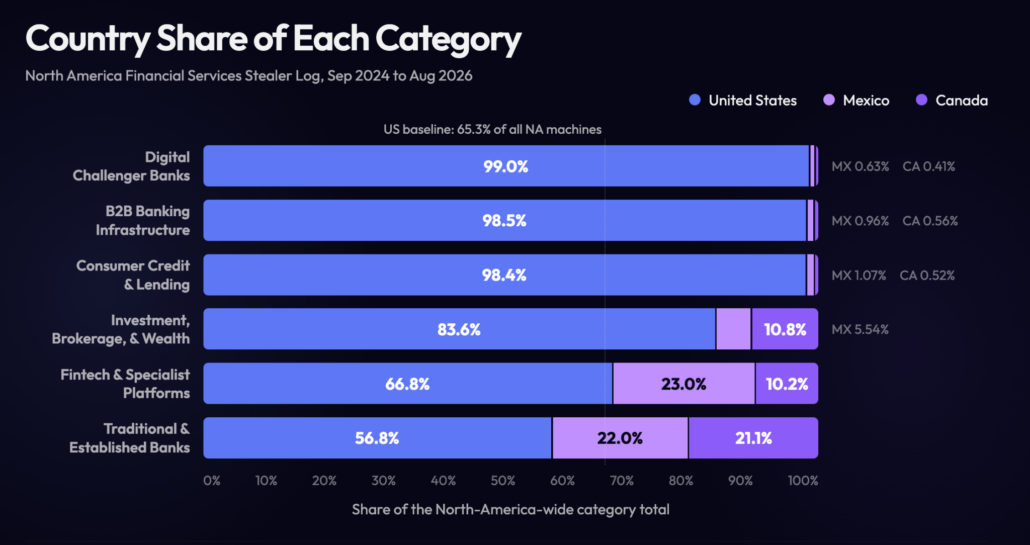
Three types of financial services are almost entirely found in logs from the US. Of every log containing a challenger bank login, 99% came from a US machine. The same was true for 98.5% of logs with banking infrastructure access and 98.4% of logs with consumer lending credentials.
Investment, Brokerage, & Wealth is less concentrated but still US-heavy: 83.6% of these machines are in the US, while Canada holds 10.8% of them, and Mexico, 5.5%. Even accounting for the fact that the US makes up about two-thirds of our dataset, these shares are well above what its size alone would explain.
This concentration largely reflects the services themselves. The numbers align with the size of the US credit market: American households held $18.8 trillion in debt in mid-2026, including $1.26 trillion in credit card balances. Most of the Consumer Credit & Lending, Digital Challenger Banks, and B2B Infrastructure platforms tracked in this report also operate mainly in the US, which is considered a bias in this report.
The Average Financial Services Log Looks Different in Each Country
A financial services log from Canada, Mexico, or the US doesn’t hold the same kind of access. The chart below shows the chance of finding each type of access in a random log from each country.
Fintech & Specialist Platforms are common ground, appearing in most logs everywhere: 87% in the US, 86% in Mexico, and 78% in Canada. Beyond that, the profiles split.
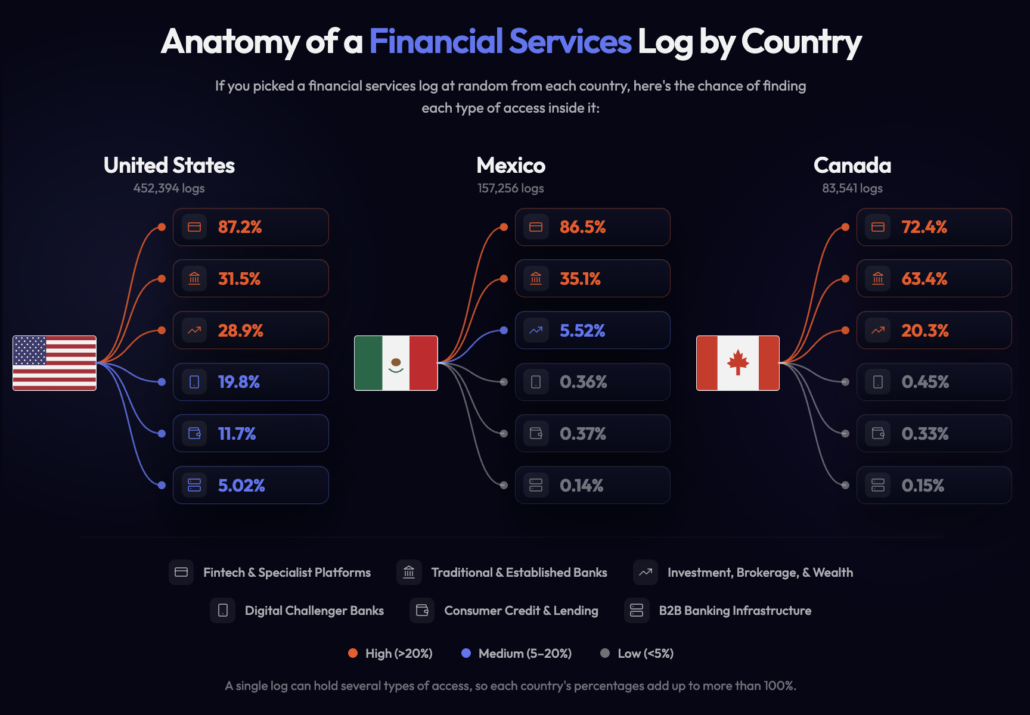
- Canada leans on traditional banks. About two in three Canadian financial services logs (63.4%) contain a Traditional & Established Bank login, compared to about one in three in the US (31.5%) and Mexico (35.1%).
- Mexico has far less investment access. Only 5.5% of Mexican logs contain Investment, Brokerage, & Wealth credentials, which is about five times less than in the US (28.9%) and four times less than in Canada (20.3%).
- Three categories are almost US-only. Digital Challenger Banks, Consumer Credit & Lending, and B2B Banking Infrastructure access appear in fewer than 0.5% of Mexican and Canadian logs. In US logs, they appear, respectively, in 19.8%, 11.7%, and 5% of the logs. As noted earlier, this could be because most of the services we track in these categories operate mainly in the US.
The average US financial services logs offer attackers the most options. In the US, every category appears in at least 5% of financial services logs. In Mexico and Canada, three of the six categories appear in fewer than one log in 200 (or fewer than 0.5%). Beyond payment platforms and bank accounts, a US log is far more likely to also contain an investment account, a challenger bank account, a line of credit, or access to banking infrastructure. For attackers, that range means more ways to cash out from a single infected machine, which likely makes US logs the most valuable in the region.
Client vs. Employee Exposure
Of the 693,191 North American financial services logs collected over the past 24 months, 2,644 contained both a platform credential and a corporate email belonging to the same company. This represents roughly 0.4% of the North American financial services stealer log volume; in other words, four out of 1,000 financial services logs in North America yield corporate access to a financial services company.
The presence of a corporate email alongside platform access on the same infected device strongly suggests the machine was used for work purposes, meaning the compromised individual is likely not a customer but an employee. Corporate exposure carries a fundamentally different risk profile: a single compromised employee credential can provide a threat actor with a foothold into internal systems, far beyond what any customer account could offer. These 2,644 logs, alongside the 2,008 banking infrastructure operator access credentials, point to a corporate attack surface that raw volume figures alone do not capture.
Interestingly, corporate exposure is not evenly spread: in Mexico and the US the rate is about three in 1,000, but in Canada it reaches one in 100. The country deep dives below explore why.
Deeper Dives, US: Financial Services Logs are up 83.1% Year-over-Year
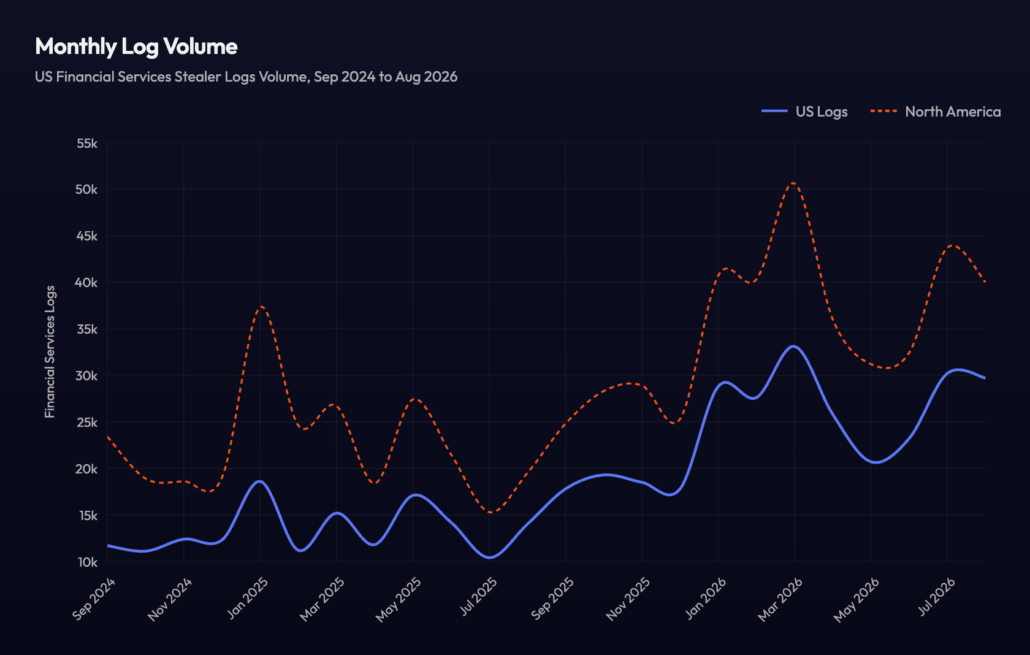
US monthly financial services log volume jumped 83.1% in a year, from an average of 13,317 logs a month (September 2024 to August 2025) to 24,383 (September 2025 to August 2026). That’s about 11,000 more logs every month. That’s well above the 56.3% growth across North America, and it accounts for most of it. Of the roughly 12,800 extra logs a month seen region-wide, about 11,000, or nearly 90%, came from the US.
In total, US machines produced 452,394 financial services stealer logs over the last 24 months. As the figure below shows, the US line (blue) follows the North American trend (red dotted line) closely, at a lower scale.
Client vs. Employee Exposure
Of the 452,394 US financial services logs that surfaced over the last 24 months, 1,336 logs contained both a financial service access credential and a corporate email belonging to the same company, representing 0.3% of US financial services logs. When a corporate email account and platform access are found together on the same compromised device, it’s a strong indicator that the device was being used for professional activities, suggesting the affected individual is an employee rather than a customer. This distinction matters significantly, as employee credentials pose a far greater danger than customer accounts: a single compromised login can give attackers direct entry into internal corporate systems.
Here are the total counts of the top five organizations with US-located financial services logs with a corporate email and credentials for the same brand in each category.
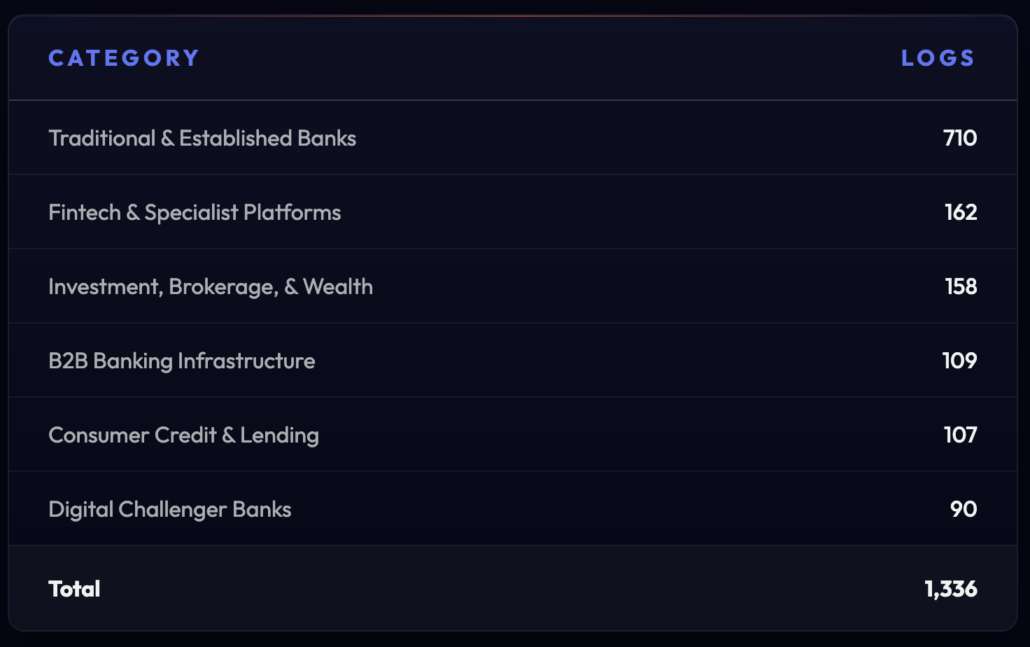
Over the last 24 months, 1,336 US-located logs held both credentials for a financial service and a corporate email from the same company. At 50.5% of North America’s corporate exposure, the country is slightly under-represented compared with its share of all North American fintech logs (65.3%).
Traditional & Established Banks dominate US financial services corporate exposure. They account for 710 of these logs, over half of the US total, and one company alone accounts for 162. That’s more than any other entire category.
Digging more into this one example with 162 corporate exposures, these machines allow to see which access was captured inside the log. 65 machines, 40.1% of the 162, hold a credential for an internal employee system. 87 machines, 53.7%, fall into the likely-internal, business-partner-or-internal, and uncertain access: they hold a corporate credential that is not a consumer banking page, but the hostname alone cannot confirm whether the access is employee, commercial client, or simply unidentifiable. Only 11 machines, 6.8%, hold consumer banking logins only and nothing else. Across all access, every machine carries a @[companyname.com] address: whatever the captured credential points to, each one belongs to someone who held corporate access at some point.
The remaining five categories are much smaller and fairly even, each accounting for between 6.7% and 12.1% of US financial services corporate exposure.
Two things stand out in the Traditional & Established Bank section: Mexican banks appear with sizable counts, with 151 logs, 11.3% of the US total. Possible explanations include staff at US branches or subsidiaries or cross-border workers. Canadian banks show the same pattern, with five companies accounting for 157 logs on US machines. Two of these companies run large US retail operations, so US-based staff are the likely explanation there.
B2B Banking Infrastructure also carries more weight here than its size suggests. Two companiesaccount for 100 corporate logs, which matters more than the raw number implies given how many institutions depend on these vendors’ systems.
Taken together, corporate exposure is a small slice of the US’s financial services logs but the most consequential one. Where the customer-credential findings in this report speak to consumer fraud risk, these 1,336 devices point to a supply-chain and insider-access risk. The breakdown of the Traditional & Established Bank with 162 corporate exposures shows what that means in practice: only 6.8% of those machines held nothing but a customer banking page, while the rest reached employee systems or access that could not be ruled out as internal. These are potential corporate endpoints, either a personal or a corporate machine, used for corporate activity/by a(n) (possible former) employee of the company.
Note: Counts largely reflect workforce size and customer base, not the relative security posture of any institution.
Mexico is the Exception: Financial Services Logs Down 4.8% in a Year
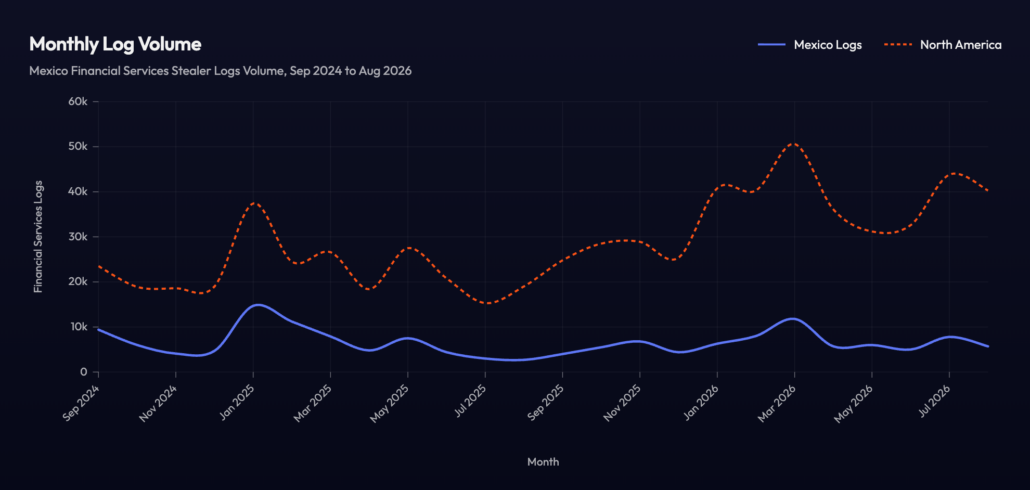
Mexico accounted for 157,256 of North America’s 693,191 financial services logs over the last 24 months. Unlike the rest of the region, its volume didn’t grow. Mexican volumes averaged 6,714 financial services logs a month from September 2024 to September 2025, and 6,390 logs a month over the following year. That’s a 4.8% decrease, against an 83.1% rise in the US and 56.3% across North America.
As a result, Mexico’s share of the region is shrinking. In the first year, it produced 30% of North America’s monthly financial logs. In the second year, that fell to 18.1%.
The chart below shows why. Mexico’s biggest month came early, with a spike of nearly 15,000 logs in January 2025. Volume then fell steadily to a low of 2,742 in August 2025. The stealer log count did pick up during the region’s eight-month climb, reaching about 11,690 in March 2026, but the rise was very modest and started from a much lower point. Since then, it has settled between 5,000 and 8,000 logs a month, below its first-year level.
Client vs. Employee Exposure
Of the 157,256 Mexico-located financial services logs collected over the past 24 months, 439 contained both a financial service access credential and a corporate email belonging to the same company, representing just short of 0.3% of Mexican financial services logs. Finding a corporate email address paired with platform access on one infected machine points strongly to work-related usage, which implies the victim is more likely an employee than a customer. This matters because employee-level exposure introduces a distinct and more severe threat: unlike customer credentials, a single compromised employee login can serve as an entry point into an organization’s internal infrastructure. Combined, these 2,644 logs and the 2,008 access credentials linked to banking infrastructure operators expose a corporate attack surface whose scale isn’t apparent from log volume alone.
Here are the total counts of the top five organizations with Mexico-located financial services logs with a corporate email and credentials for the same brand in each category.
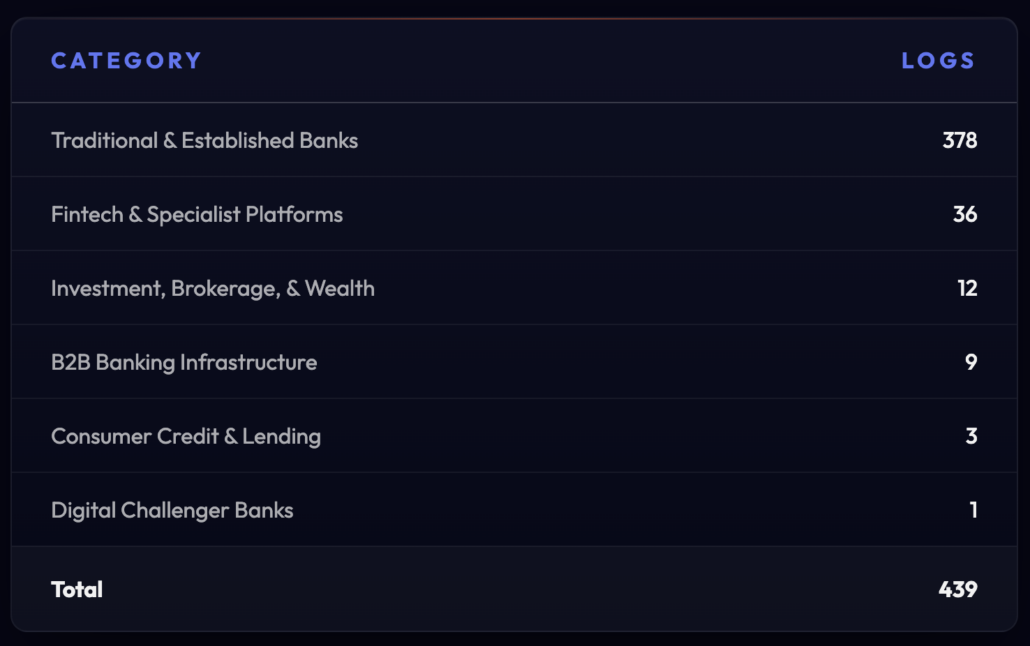
Over the last 24 months, 439 Mexico-located logs held both credentials for a financial service and a corporate email from the same company. At 16.3% of North America’s corporate exposure, the country is slightly under-represented compared with its share of all North American financial services logs.
Traditional & Established Banks dominate the Mexican financial services corporate exposure. Alone, they account for 86.1% of Mexican corporate exposure, against about half in the US. The two largest banks in this dataset alone account for 264 logs, 60.1% of the Mexican total.
Examining the two largest banks in the Traditional & Established Banks category shows a pattern sharper than anything in the US data: the captured credentials point at staff systems far more often than at customer pages. At one bank, 114 of 146 machines, 78.1%, hold a credential for an internal employee system. In the second largest bank, the exposed credential count is lower but still majority internal at 66 of 118 machines, 55.9%, concentrated in server infrastructure rather than portals.
What is missing is just as striking. Consumer banking accounts for under 2% in both cases, and neither bank shows any genuine corporate-client population. The remaining machines carry only the bare registrable domain with no page detail, so the access cannot be identified either way. Across both banks, every machine carries a corporate email address, so whatever the captured credential happens to point at, each one belongs to someone who held corporate access at some point.
Taken together, employee exposure is a small slice of Mexico’s financial services logs but a consequential one, weighted toward Traditional & Established Banks. Where the customer-credential findings elsewhere in this report speak to consumer fraud risk, these 439 devices point to a supply-chain and insider-access risk. The access found for the two largest banks make that concrete. The credentials captured are not customer sign-on pages but the authentication layer itself: a SAML token service at one bank, named production Linux and SAP hosts at another.
Note: Counts largely reflect workforce size and customer base, not the relative security posture of any institution.
Canada: Financial Services Logs Increased 77.9% in a Year
Canada accounted for 83,541 of North America’s 693,191 total financial services logs over the last 24 months. Its volume grew almost as fast as with the US-located stealer logs. Canadian machines averaged 2,505 financial services logs a month from September 2024 to August 2025, and 4,456 a month over the following year. That’s a 77.9% increase, close to the US (83.1%) and well above North America as a whole (56.3%).
Because Canada starts from a smaller base, that growth adds far fewer logs than in the US: about 2,000 more a month, against 11,000. Canada’s share of the region has still edged up, from about 11.1% of North America’s monthly financial services logs in the first year to about 12.6% in the second.
Put together, the three deep dives show where North America’s growth came from. Of the 12,800 extra logs a month seen region-wide, the US added approximately 11,000, Canada 2,000, and Mexico lost 300.
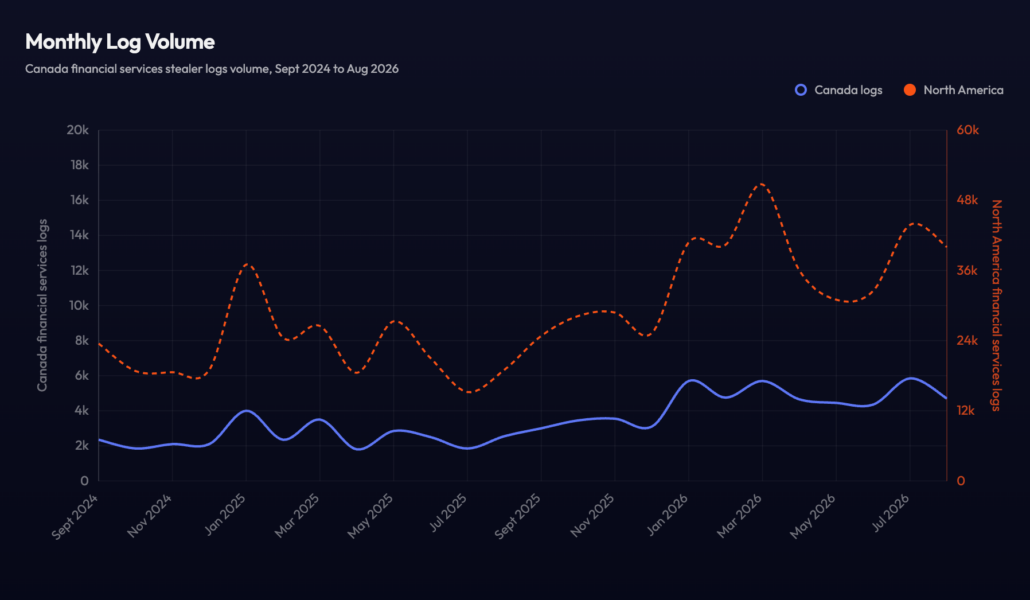
As the chart above shows, Canada’s monthly volumes closely follow the regional trends, albeit at a much smaller scale. Canada’s growth came as a steady climb rather than sharp swings. Through its first year, volume stayed between roughly 1,800 and 3,500 logs a month, with a small spike to 4,027 in January 2025 that mirrored the region. From a low of 1,888 in July 2025, it rose gradually, then stepped up to 5,708 logs in January 2026. Unlike the wider region, Canada didn’t fall back after its March 2026 peak. It has held between roughly 4,400 and 5,900 logs a month since, nearly double its first-year level.
Client vs. Employee Exposure
Of the 83,541 Canadian financial services logs collected over the past 24 months, 857 contained both a financial service access credential and a corporate email belonging to the same company, representing 1% of Canadian financial services logs. The co-occurrence of a corporate email and platform credentials on the same infected system is a strong signal that the device served a professional function, indicating the compromised user is probably an employee, not a customer. This is a critical distinction, since employee credential exposure represents an entirely different, more serious threat: a single breached login can grant attackers a pathway into internal networks, something no customer account could provide. Together, the 2,644 logs and 2,008 credentials belonging to banking infrastructure operators illustrate a corporate attack surface that sheer numbers fail to fully convey.
Here are the total counts of the top five organizations with Canada-located financial services logs with a corporate email and credentials for the same brand in each category.
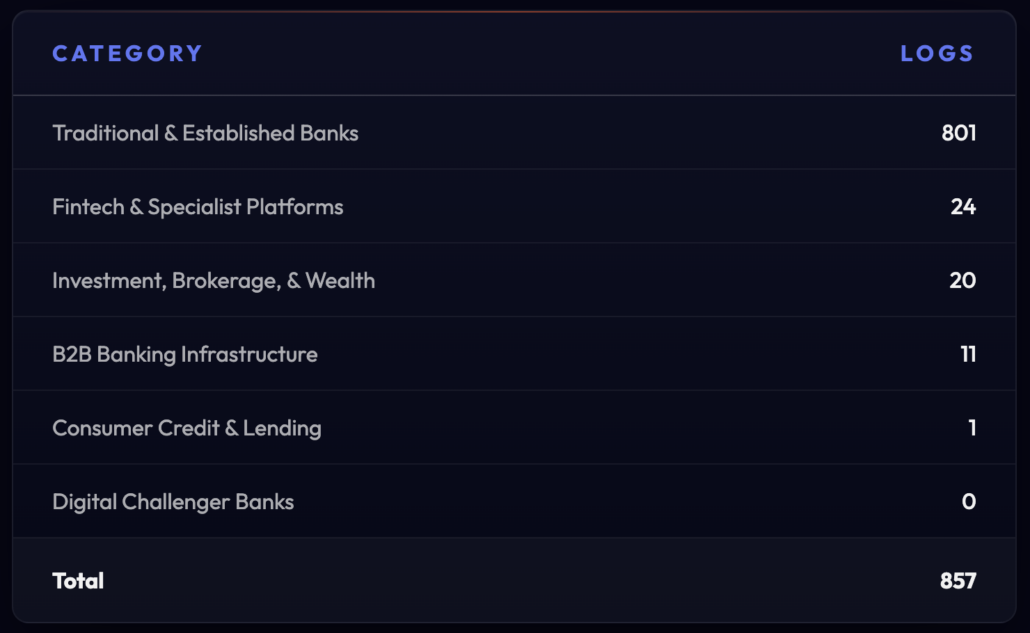
Over the last 24 months, 857 Canada-located logs held both credentials for a financial service and a corporate email from the same company. That’s 1% of all Canadian financial services logs, roughly three times the rate in the US and Mexico, where employee exposure sits at about 0.3%. Canada breaks the pattern found elsewhere in this report: with 12.1% of North America’s financial services logs, it accounts for 32.6% of the region’s corporate exposure. One company alone drives the gap: without its 565 logs, Canada’s rate would be 3.4 in 1,000, in line with the rest of the region.
Similar to trends in the aforementioned countries, Traditional & Established Banks are behind almost all of it. They account for 801 logs, 93.5% of Canada’s corporate exposure, the highest of the three countries, ahead of Mexico (86.1%) and the US (53.1%). Five of Canada’s biggest banks alone account for 778 logs, 90.8% of the country’s total, and the one company mentioned in the previous paragraph accounts for 565 of those on its own. The trend is striking: this company’s employee exposure rose from 107 logs in the first year to 486 in the second, a 4.5-fold increase concentrated since January 2026.
Digging more into these machines allows us to see which access was captured inside the log. 24 machines, 4.3% of the 565, hold a credential for an internal employee system. A further 67 machines, 11.9%, fall into bare-domain, careers-portal, and unidentified access: they hold an company credential that is not a consumer banking page, but the hostname alone cannot confirm whether the access is employee, guest, or simply unidentifiable. 474 machines, 83.9%, hold consumer banking logins only and nothing else.
Employee exposure is a small slice of Canada’s fintech logs but a disproportionate one, almost entirely in established banks. Canada is the inverse of Mexico: the region’s largest share of corporate exposure, with the thinnest internal access behind it. Yet, every machine carries an @[companyname.com] address, so each belongs to someone who held corporate access at some point. The risk is therefore one of identity more than access. These are confirmed bank staff whose work addresses now sit in stealer logs, open to phishing and credential stuffing, with potential password reuse between personal banking and work accounts. The 24 machines reaching [companyname]vpn.com are the exception, and the sharp rise through 2026 makes the trend worth watching more than the current depth.
Note: Counts largely reflect workforce size and customer base, not the relative security posture of any institution.
How Financial Services Security Teams Can Respond
Over the past 24 months, more than 693,000 North American devices carrying financial services credentials have surfaced on underground platforms, with monthly volumes now running at roughly double their 2024 baseline.
At this scale, the exposure represents a systemic threat to consumer finances, payment infrastructure, and the operational integrity of the institutions that underpin North America’s financial system.
The scale alone warrants attention, but the real concern lies in what sits inside these logs. The dataset captures every layer of the financial stack in a single sweep: the banks where salaries land, the fintech that moves money across borders, the payment rails that process merchant transactions, and the core infrastructure that keeps it all running.
Not all credentials are equal. The 2,008 banking infrastructure logs identified in this report may barely register as a percentage of the total, yet each one potentially hands a threat actor the keys to systems that run banks. The blast radius of a single compromised infrastructure credential dwarfs anything a consumer log could deliver. Financial institutions across North America should not mistake low volume for low risk.
Financial services organizations would benefit from treating stealer log exposure not as a cybercrime statistic but as an operational risk indicator. The credentials are already out there. The question is whether they are found by defenders first. With that in mind, security teams should consider the following:
- Monitor for corporate exposure, not just customer exposure. The 2,644 logs pairing a corporate email with a fintech credential are a leading indicator of employee device compromise, not customer fraud. These deserve their own detection and response track, separate from consumer-facing fraud monitoring.
- Prioritize banking infrastructure credentials for immediate triage. A single compromised login to a core banking vendor, card-issuing platform, or payment rail can expose every institution running on that system. These 2,008 logs should trigger faster response times than raw volume alone would suggest.
- Extend monitoring to vendor and subsidiary staff, not just direct employees. The presence of Mexican and Canadian bank credentials on US-located machines suggests exposure can originate from cross-border operations or subsidiary staff, populations that often fall outside standard employee monitoring programs.
- Don’t rely on regional patterns to set risk thresholds. Challenger banks, consumer lending, and infrastructure credentials cluster heavily in the US today, but that reflects where these services currently operate, not a ceiling on future exposure elsewhere in the region.
Acting Upon these Numbers
The numbers in this report describe a problem that is getting bigger, not one that is stabilizing. Financial services credentials are being harvested at nearly double the rate they were two years ago, and the growth is not evenly distributed. It is concentrated where the most valuable access lives: employee endpoints, infrastructure vendors, and the institutions that other institutions depend on. That concentration is the real story here. A consumer whose login gets stolen faces a personal, contained problem. A bank whose card-issuing platform credential gets stolen faces a problem that belongs to every customer of every institution running on that platform.
None of this requires a new kind of attack to become a serious risk. The credentials already exist, sitting on underground forums, sorted and priced, waiting to be used. What separates a contained incident from a systemic one is simply who finds them first. For financial services companies and the banks they connect to, that is no longer a question that can wait for the next audit cycle to answer.
Identity-First CTI for Financial Services
1,773,227 infected devices across North America. Want to check if your customers and employees among them?
Financial services stealer logs in North America are up 56.3% year-over-year, and over 2,000 infected machines held operator access to systems banks depend on. Flare monitors underground forums and stealer log markets so you can find exposed credentials before attackers use them.
Methodology
This report covers stealer logs from infected machines geolocated in the United States, Mexico and Canada, shared between September 2024 and August 2026. A log was counted in a category if it contained credentials for at least one of the domains below, including any subdomain. A single log can fall into several categories, so category totals overlap.
Traditional & Established Banks (23)
Digital Challenger Banks (4)
Fintech & Specialist Platforms (5)
Investment, Brokerage, & Wealth (6)
Consumer Credit & Lending (4)
B2B Banking Infrastructure (21)
Corporate Exposure
A log was counted as corporate exposure when it contained both credentials for a tracked brand and an email address on that brand’s corporate domain. A match indicates the device likely belonged to an employee, but the financial services credential may be their personal account with their employer rather than access to internal systems.